A carbon price surge in Europe pulling up LNG prices in China? This may sound like a case of the butterfly effect. But the current tandem rise in carbon and gas prices reflects an important linkage through the European power sector.
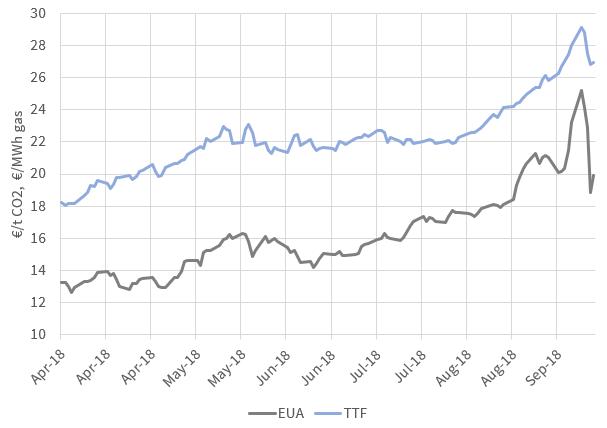
The carbon vs gas price relationship has come into focus this year as the result of surging carbon EUA prices. Carbon prices topped 25 €/t last Monday, a 142% move higher from the start of Q2 2018 (when prices were 13 €/t).
As carbon prices have increased, so has price volatility. After peaking on Monday last week, EUA prices fell 20% by Friday to close the week just under 20 €/t.
The TTF gas curve and Asian spot LNG prices have risen in parallel with carbon since Q1. They also fell in sympathy with the steep decline in EUA prices across last week.
The mechanics of this linkage between gas and carbon prices is underpinned by gas vs coal plant switching in European power markets, as we set out in this week’s article.
What is driving carbon higher
Carbon prices have rallied this year in response to finalisation of the Market Stability Reserve (MSR) measures. The MSR has been a long time coming, but represents a clear mechanism to reduce the surplus of carbon credits that has built since the financial crisis.
Under the MSR, surplus carbon inventory will be removed at the rate of 24% a year across 2019-23. Culling of EUAs will then continue beyond this at a 12% rate.
The net impact of the MSR has been to reignite the requirement for market driven emissions abatement from the power sector. In other words, the EUA market anticipates a shortage of emissions allowances, which needs to be cleared via higher prices.
The key mechanism driving carbon abatement at the margin, is the switching of coal units for CCGTs. Germany is particularly important given its large switching potential, with 28GW of installed hard coal capacity and more than 20GW of gas-fired capacity (currently running at relatively low load factors).
Switching linkage between gas & carbon
Rising carbon prices hurts coal plant competitiveness versus gas. The carbon intensity of coal-fired units is more than double that of CCGTs (e.g. 0.85 vs 0.35 t/MWh of power produced). This means the variable cost of coal plants rises faster than CCGTs in response to a carbon price increase.
Everything else being equal, this carbon induced shift in competitiveness in favour of gas plants results in higher CCGT load factors. This in turn causes higher gas demand which acts to pull up European gas hub prices.
Movements in forward prices anticipate this relationship. In other words, a move higher in carbon prices is typically accompanied by a move higher in gas prices to maintain similar gas vs coal switching levels. This dynamic can be observed in Chart 1.