Global LNG demand is growing at double digit pace (around 10% a year since 2016). Growth is focused on developing economies in Asia (e.g. China & India). It is also being supported by a local pollution and emissions driven shift from coal to gas.
“This capability is analogous to the advanced navigation systems on the bridge of a modern ship… versus trying to steer with line of sight vision”
LNG market growth is driving value creation opportunities. Producers, suppliers & traders are all expanding their supply chain presence with a view to targeting value growth. Portfolio growth is generating a number of interesting commercial questions, with some examples in the table below.
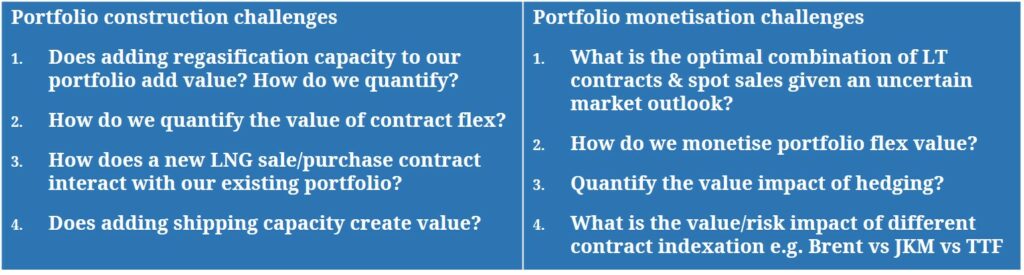
LNG portfolio value creation poses a unique set of challenges. These are caused by complex physical logistics, the unique characteristics of LNG price behaviour and the strong value interdependence of portfolio components.
These challenges mean that LNG asset investment, contracting and hedging decisions need to be considered from a portfolio perspective, rather than on a standalone basis. Otherwise value is left on the table and risk cannot be properly quantified.
In today’s article we explore LNG portfolio valuation via a practical case study. We define the portfolio components and then analyse these using our in-house portfolio valuation model (LNG Bridge) to demonstrate intrinsic & extrinsic value creation and the evolution of portfolio value distributions.
The case study portfolio
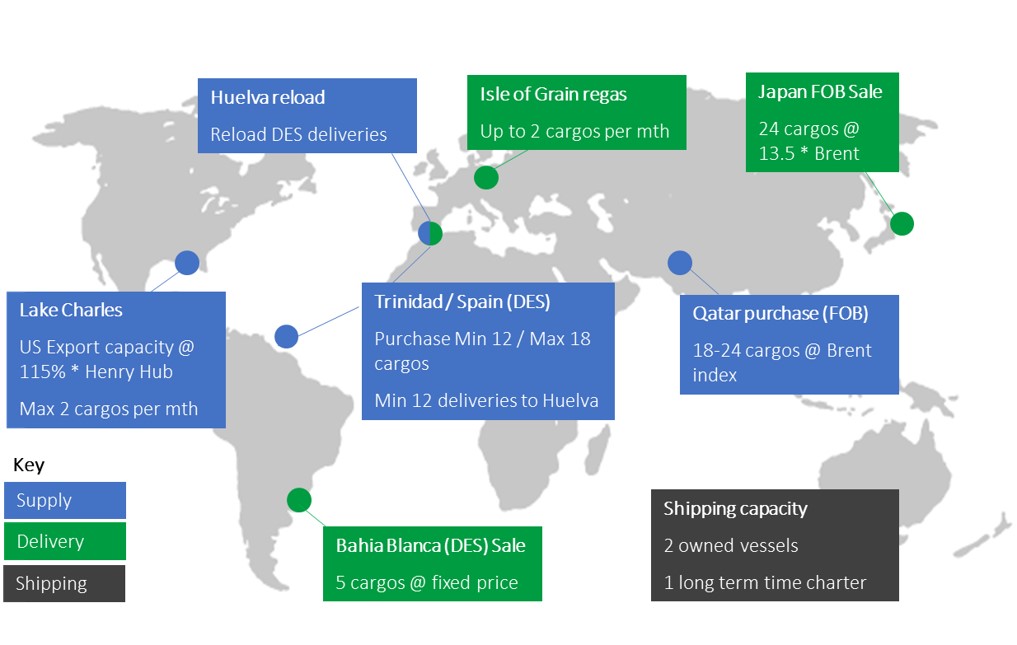
The case study LNG portfolio is summarised in Diagram 1.
Diagram 1: Base portfolio components
Source: Timera Energy
Sources of portfolio supply are shown via the blue boxes:
- Henry Hub indexed US export capacity with diversion flexibility
- A Trinidad to Spain DES supply contract, with option to reload cargoes in Spain for re-export
- A strip of Brent indexed FOB cargo purchases from Qatar.
Delivery options & obligations are shown via the green boxes:
- Fixed price DES sale into Argentina
- Brent indexed FOB sale into Japan
- Regas capacity delivery optionality into the UK.
The portfolio also has shipping capacity in the form of two ‘owned’ vessels and a vessel on long term time charter.
While this portfolio is purely fictional, it contains many assets and exposures that are commonly found in actual LNG portfolios.
Analysing portfolio intrinsic value
The starting point for analysing the value impact of any new asset, contract or hedging strategy, is to value the existing ‘base portfolio’. We do this in our model by applying a sophisticated but transparent ‘mixed integer program’ technique.
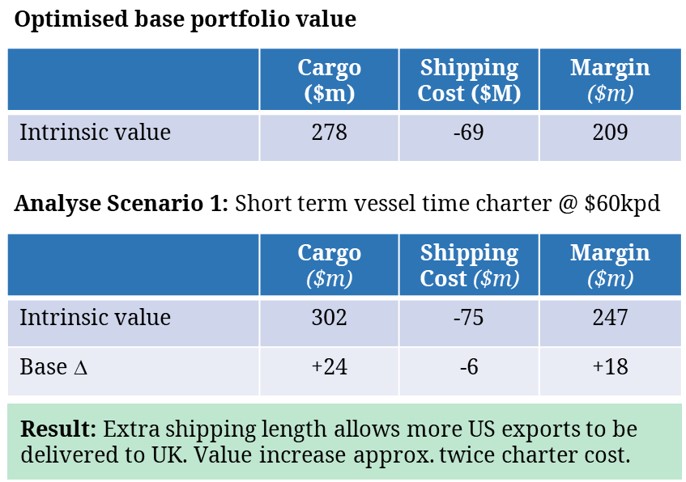
If that sounds like gibberish, it is just quant jargon for optimising cargo margins based on a given set of market prices (e.g. Henry Hub, TTF/NBP, JKM, Brent) and shipping costs. The optimised intrinsic value of the base portfolio is set out in the top table in Diagram 2, broken down by cargo margin and shipping cost components.
Diagram 2: Base portfolio value and Scenario 1 value creation
Source: Timera Energy
The simplest and most transparent form of value creation analysis involves quantifying the intrinsic portfolio value impact of a change to the portfolio. For example, measuring the value impact of a new portfolio component against a single set of market prices.
We illustrate this with Scenario 1, where we consider the value impact of adding some shipping capacity to the portfolio via a short term vessel charter at a cost of 60,000 USD/day.
This additional shipping length alleviates a constraint around moving LNG across the portfolio. It allows the more effective movement of US export cargos from the Gulf Coast to the UK. The extra margin captured on these cargos outweighs the incremental cost of the shipping capacity, increasing portfolio value as shown in the second table in Diagram 2.
Analysing portfolio extrinsic value
While intrinsic value is a good place to start, a competitive edge in LNG portfolio value creation requires proper extrinsic value analysis. Valuing portfolio optionality against a single intrinsic price path will typically significantly underestimate true value. This e.g. undermines a company’s ability to bid competitively for assets or contracts.
The key element missing from intrinsic analysis is capturing the impact of market price movements. The flexibility of LNG portfolios to respond to changes in price is often where real value creation advantage lies.
We tackle extrinsic value in our LNG portfolio model by using a Monte-Carlo price simulation framework. We generate 500+ simulations of correlated HH, NBP, TTF, JKM & Brent spot and forward price paths and optimise portfolio value against each of these to generate a portfolio value distribution, as shown in Diagram 3.
Diagram 3: Full base portfolio value distribution and extrinsic value
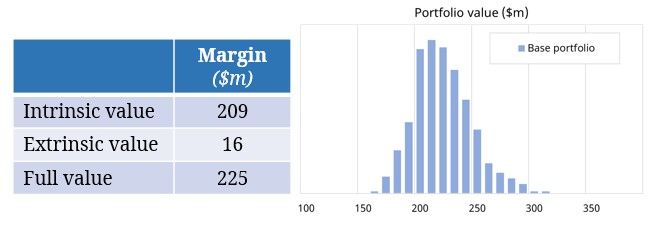
Source: Timera Energy
It is important to note that LNG price distributions are complex and unique. They are impacted by important boundary levels e.g. JKM soft lower bound relationship to TTF and TTF to Henry Hub.
Correlation and volatility levels also depend on the prevailing market ‘regime’ e.g. price spread divergence, lower correlations & higher volatility in a ‘tight market’ and the opposite conditions in a ‘well supplied’ market. These dynamics are challenging and need to be properly captured in the price simulation engine.
We consider two scenarios with an extrinsic value lens in Diagram 4.
Diagram 4: Extrinsic value analysis of Scenarios 2 (hedging) & 3 (new LT contract)
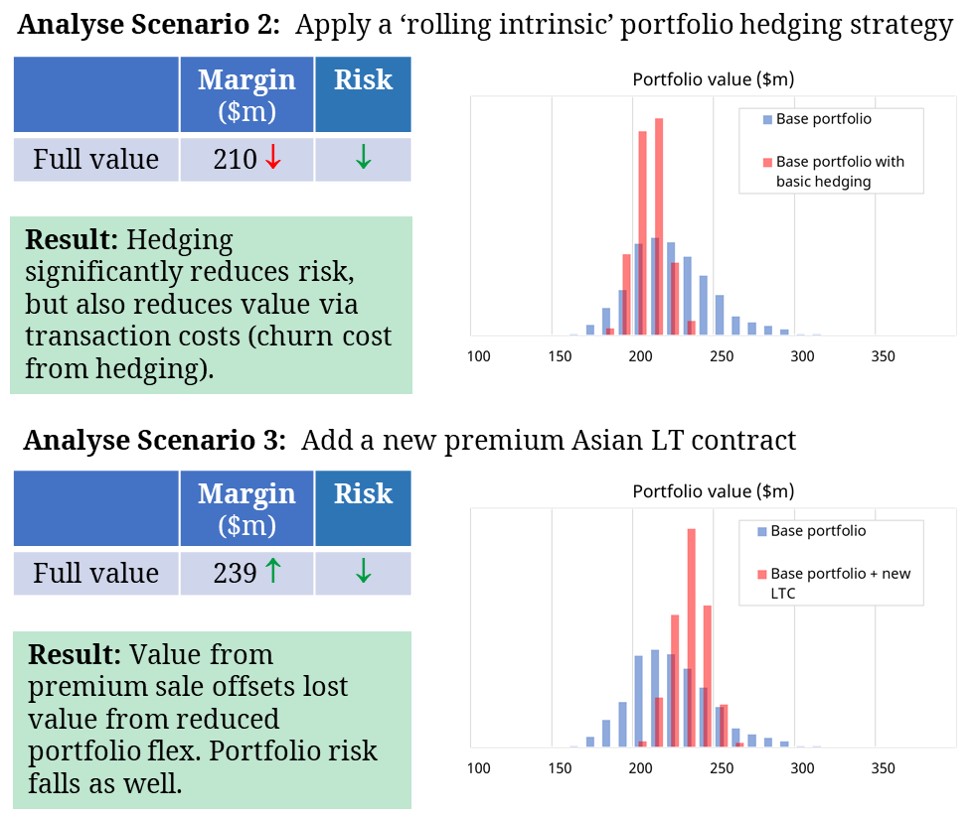
Source: Timera Energy
In Scenario 2, we look at the impact of overlaying a simple dynamic hedging strategy (a rolling intrinsic strategy) compared to the base portfolio (which we assume is optimised but not hedged).
The portfolio value distribution impact of this strategy can be seen in the chart to the right. Hedging significantly reduces portfolio risk (i.e. the value distribution narrows). There is also a reduction in expected portfolio value reflecting the transaction costs associated with hedging (crossing the market bid-offer spread as hedges are adjusted).
Scenario 3 considers the addition of contract selling LNG to an Asian buyer at a premium price. The commitment to supply gas reduces portfolio flexibility which negatively impacts value (although it also reduces portfolio risk). But this value loss is more than offset by the extra value gained from the premium sale.
Steering From The Bridge
The case studies above illustrate how a Monte-Carlo simulation based LNG portfolio valuation model supports value creation. The model enables commercial decisions to be made based on their risk/return impact on the portfolio value distribution. It also provides a clear competitive advantage in valuing assets and managing risk.
This capability is analogous to the advanced navigation systems on the bridge of a modern ship. Analysing individual assets or contracts on a standalone basis is akin to trying to steer a ship with line of site vision.
Briefing pack: Steering from the Bridge (click on this title for PDF)
This pack sets out key commercial challenges, portfolio analysis methodology, pitfalls and further practical case studies. The pack draws on Timera Energy’s recent work where we’ve been engaged by a number of large LNG portfolio players to deliver portfolio analysis solutions. |