Shipping costs seems like a relatively obscure topic. Yet one of the most popular articles in our blog archive is a 2013 article that provides a breakdown of LNG shipping cost components.
So why are people interested? The delivery of LNG cargoes is increasingly being optimised against spot price signals. Margin opportunities in moving LNG between regions depends on the cost of transportation. This means that shipping cost differentials have become key drivers of LNG flows & regional price spreads.
Given that context we are publishing an updated version of the article to address a number of developments over the last 5 years.
Cost component breakdown
The following factors are the key determinants of shipping costs from point A to B.
Chartering fee: This is the payment for securing access to shipping capacity by chartering a vessel. There are broadly three ways to access shipping capacity: (1) own vessel capacity (2) time charter and (3) single voyage or spot charter. Spot charter rates are generally higher and certainly more volatile than longer term time charter rates. Strong Asian demand across this winter has seen spot charter rates rise to between $70-80k per day for 160,000 mcm vessels.
Brokerage: Vessel charters are typically arranged through specialist brokers and attract a 1-2% fee.
Vessel type: Historically most LNG vessels were powered by Steam Turbines (ST) which can burn a combination of heavy fuel oil (HFO) and boil-off gas in their boilers. Modern diesel engines have replaced STs in new vessels delivered over recent years. Dual / Tri Fuel Diesel Engine (D/TFDE) can also burn a mixture of HFO and boil-off gas but are much more efficient (reducing fuel costs). Vessel size is also an important determinant of voyage economics and cost. The most common size is around 147k to 160k m3 but larger vessels are also available between 210k m3 (Q-Flex) and up to 260k m3 (Q-Max).
Fuel cost: The voyage fuel or ‘bunker’ consumption is directly proportional to the distance and speed of the vessel. This is typically the second largest cost component after the chartering cost. The different propulsion mechanisms and fuel burn options add some complexity. Most LNG vessels can burn fuel oil, boil-off gas or a blend of both in their boilers. As a result the calculation of fuel cost is closely tied to that of boil-off gas.
Natural boil-off occurs at a rate of ~0.1-0.2% of inventory per day and at times boil off is forced above this level to further reduce fuel oil requirements. Some modern LNG vessels also have the ability to re-liquefy boil-off gas, keeping the cargo whole (while running on more fuel efficient diesel engines).
LNG vessels also require a minimum inventory (called “heel”) to keep the tanks cool (and fuel for unladen voyages if running on boil-off). Calculation of direct fuel consumption is fairly straightforward but the opportunity cost of LNG boil-off is also an important consideration.
The choice of fuel blend influences achievable speeds e.g. around 14 knots running on boil-off alone compared to around 19 knots running on HFO or forced boil-off. Speeds in turn can also have implications for charter costs and ability to reach a destination in time to capture premium spot prices.
Port costs: The components and level of the costs of loading and unloading at ports can vary widely depending on location. For example, ports in less stable regions can levy large security charges associated with ensuring the safety of the vessel.
Canal costs: Transit costs have to be paid for using the cross-continental Suez and Panama canals. Canal transit costs are in the region of USD 300-500k per transit. The Panama canal widening project, completed in 2016, has opened up the route to the majority (~80%) of LNG vessels. Previously only a small fraction of the LNG tanker fleet could squeeze through. This is an important development for US export projects as the canal transit reduces the distance and cost from the US Gulf Coast to premium Asian markets.
Insurance costs: Insurance is required for the vessel, cargo and to cover demurrage (liabilities for cargo loading and discharge overruns).
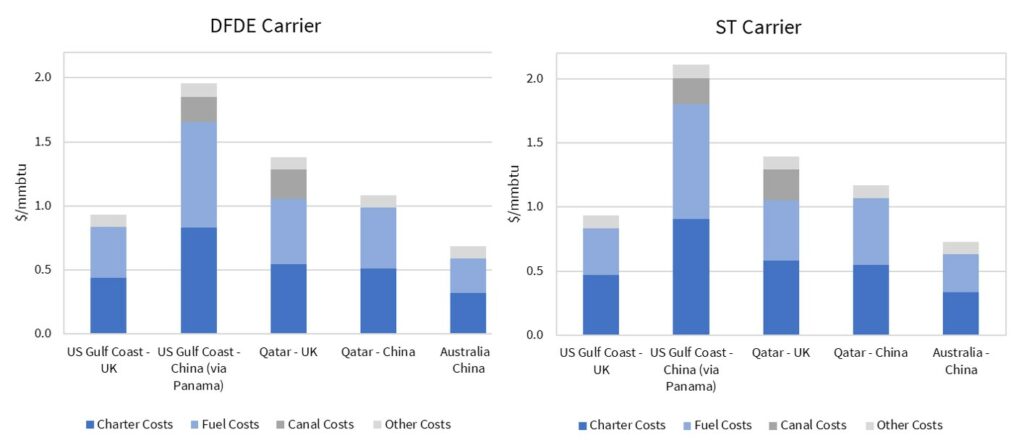
Putting the pieces together
Once you have reflected the components above in a shipping cost calculator, it is a relatively simple analytical exercise to estimate shipping costs. In Chart 1 we show OIES analysis by Howard Rogers (a senior member of the Timera gas team) illustrating the cost breakdowns of different vessel types.