European hub prices have fallen 40% since Sep 2018. This is a substantial move over a five month period. It is even more impressive because the price decline has occurred across winter.
In today’s article we look at why gas prices are falling hard in Europe and Asia. We also consider the important shift in European gas forward curves that has occurred at the same time.
A price jump followed by an even more rapid decline
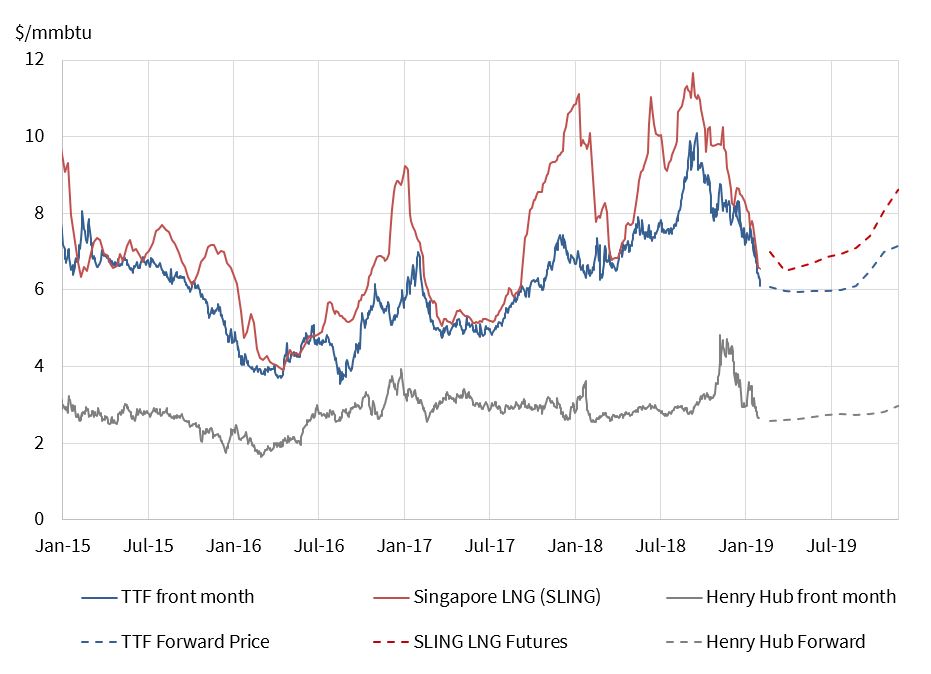
Less than 6 months ago a carbon price surge pushed TTF prices to 10 $/mmbtu (almost 30 €/MWh). This happened against the backdrop of an unusually tight LNG market across summer 2018. European and Asian markets were competing for available LNG cargoes, driving Asian LNG spot prices towards 12 $/mmbtu.
Chart 1 shows that the associated summer 2018 surge in European spot prices from 8 to 10 $/mmbtu was short lived, with prices falling back to 8 $/mmbtu by early Q4. But the chart also shows an even more rapid decline in spot gas prices across December and January (from 8 to 6 $/mmbtu). That is quite unusual behaviour across the coldest months of winter.
It is no coincidence that the decline in gas prices since the end of Q3 2018 has been accompanied by a sudden rise in LNG flows to Europe.
Europe is soaking up surplus LNG
Europe’s liquid hubs (TTF & NBP) act as a sponge to mop up surplus cargos from the LNG market. With Asian LNG portfolios well contracted into Winter 18/19, Asian buyers have been net sellers of spot cargoes this winter. This is coinciding with the LNG market entering its most intense phase of volume ramp up from the current wave of new LNG supply projects.
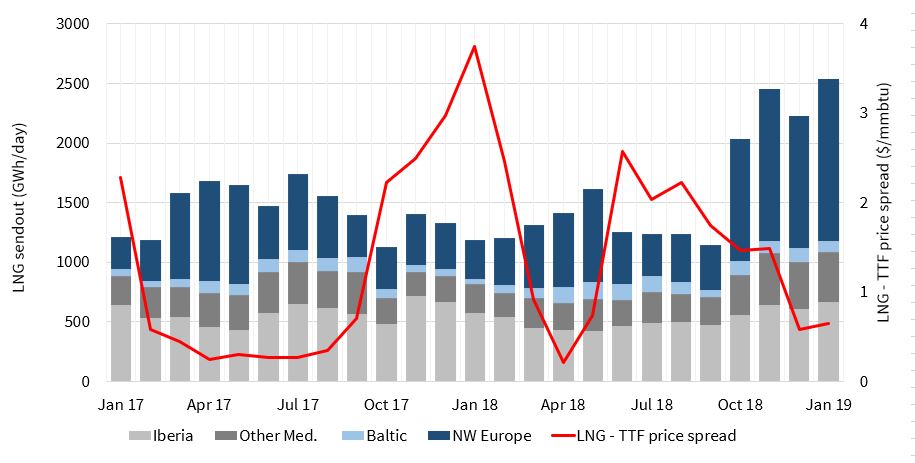
These two factors combined to tip the LNG market into surplus in Q4 2018. As a result, the Asian spot price spread over TTF has fallen back under 1 $/mmbtu. This no longer covers the variable cost to transport LNG to Asia and there has been an associated surge in LNG imports into North-West European hubs as shown in Chart 2.
Spot LNG charter rates have also declined towards $50k per day from above $200k in Q3 2018. This is consistent with reduced journey durations as LNG flows via shorter routes to Europe.
It is European power markets that are soaking up most of the incremental gas supply as LNG imports rise. Falling gas prices are reducing the variable cost of CCGTs and tipping the competitive balance from coal towards gas plants.
Increased power sector gas burn so far this winter has been most pronounced in Germany and the Benelux region. Gas for coal plant switching looks set to continue gathering pace as 2019 progresses.
While the impact of these large moves in spot gas prices is interesting, it is perhaps more important to understand what the impact has been on gas forward prices. These have a stronger influence on asset hedging, investment and retirement decisions.
A major shift in European gas curves
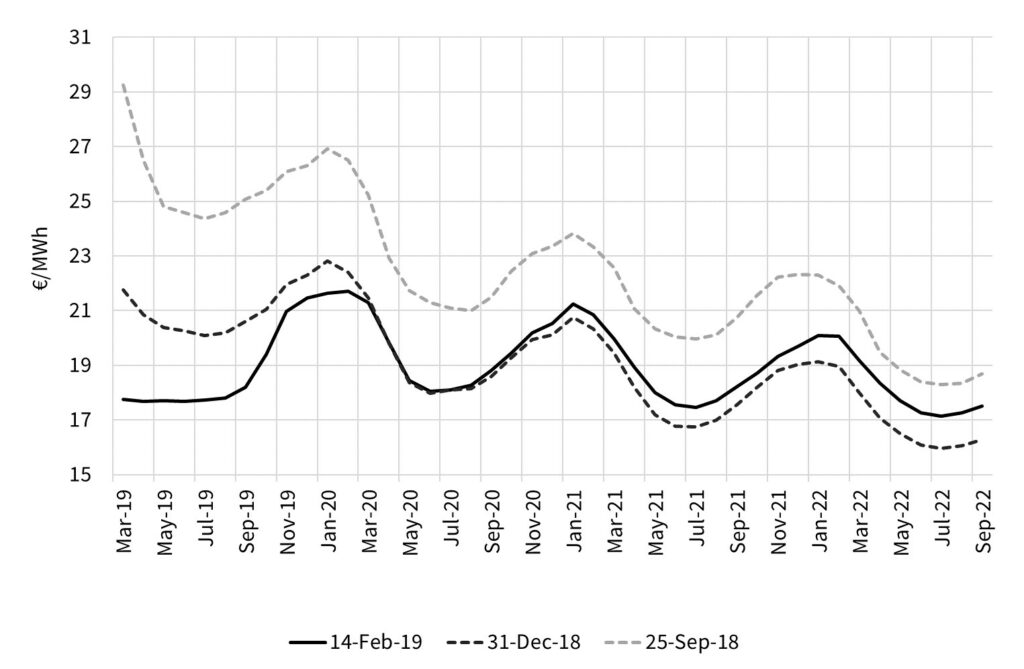
Chart 3 shows the current TTF forward curve compared to curves at the end of Q3 and Q4 2018.
The transformation of the TTF forward curve since Q3 2018 can be considered as the combination of two dynamics:
- Falling: Between Sep and Dec 2018, the whole TTF curve declined. This was driven by a revision of market expectations on (i) European economic growth & therefore gas demand and (ii) the volume of surplus LNG available to flow to Europe.
- Flattening: In 2019, the quite steep backwardation that existed in 2018 has been driven out of the TTF forward curve as it has flattened. The curve has tilted relative to its position in Dec 2018, falling at the front and rising at the back.
There has been a particularly sharp move lower in the front months of the TTF curve this year. Spring appears to be making an early appearance with warmer than usual weather. This has contributed to European storage inventories sitting at unusually high levels.
A flat forward curve through summer offers little value from further storage withdrawals. However this 2019 curve flattening has significantly increased the 2019 summer/winter spread at TTF (up from 1.5 around 3.0 €/MWh).
The factors pulling down the front of the gas curve are really 2019 ‘within-year’ effects. The back of the TTF curve has actually risen since December as a broader recovery in commodity & financial markets has taken place since the Dec 2018 slump.
2019 is set to be a year to watch intermarket relationships closely. Interaction with the LNG market will be an important driver of the European supply picture. The relationship between gas and coal plants in European power markets will be the key price responsive mechanism on the demand side.
Movements in the gas forward curve help shed some light on how market expectations of these intermarket relationships are evolving.