European hub prices doubled between July 2017 and September 2018. 50% of that move happened in Q3 2018. Through the objective barometer of market price, the European gas market has tightened significantly across 2017-18.
The big rally in gas prices between the current and previous summers was fuelled by:
- LNG volumes being diverted to Asia to meet strong demand
- Big rallies in coal and carbon prices, raising gas plant switching levels in the power sector
- Near term constraints on ramp up of Russian import volumes.
We described these 3 key drivers of hub prices in a recent article published in October.
In Q4 there has been another interesting shift in gas market dynamics. Gas prices have fallen back sharply from September levels and LNG is flowing back into Europe in a very different pattern to the onset of the last two winters.
In today’s article we provide a brief summary of why gas prices are falling and the current state of play heading into winter.
What is behind the Q4 price plunge?
Energy markets are rarely dull as illustrated by the evolution of global price benchmarks in Chart 1. TTF prices rose more than 25% across this summer (from around 8 to 10 $/mmbtu), only to reverse and give up those gains across October. As of late November prices look to be trying to stabilise around 8 $/mmbtu.
Chart 1: Evolution of global gas price benchmarks
So why this sudden price reversal? To a large extent this comes down to the same drivers behind the Q3 price rise, only acting in reverse. The following is a summary of 5 factors behind the Q4 price decline:
- Economy: Forward expectations of gas demand are sensitive to economic conditions. Global stock markets have fallen sharply across Oct-Nov as trade war tensions grow, interest rates continue to rise and central bank stimulus starts to roll off.
- Commodity prices: Consistent with 1., European gas prices have fallen in sympathy with a broad based decline in commodity prices in Q4 e.g. oil -25%, coal -15%, carbon -20%.
- Switching levels: Power sector switching levels have fallen with coal and carbon prices, reducing gas demand as the relative competitiveness of coal plants increases accordingly.
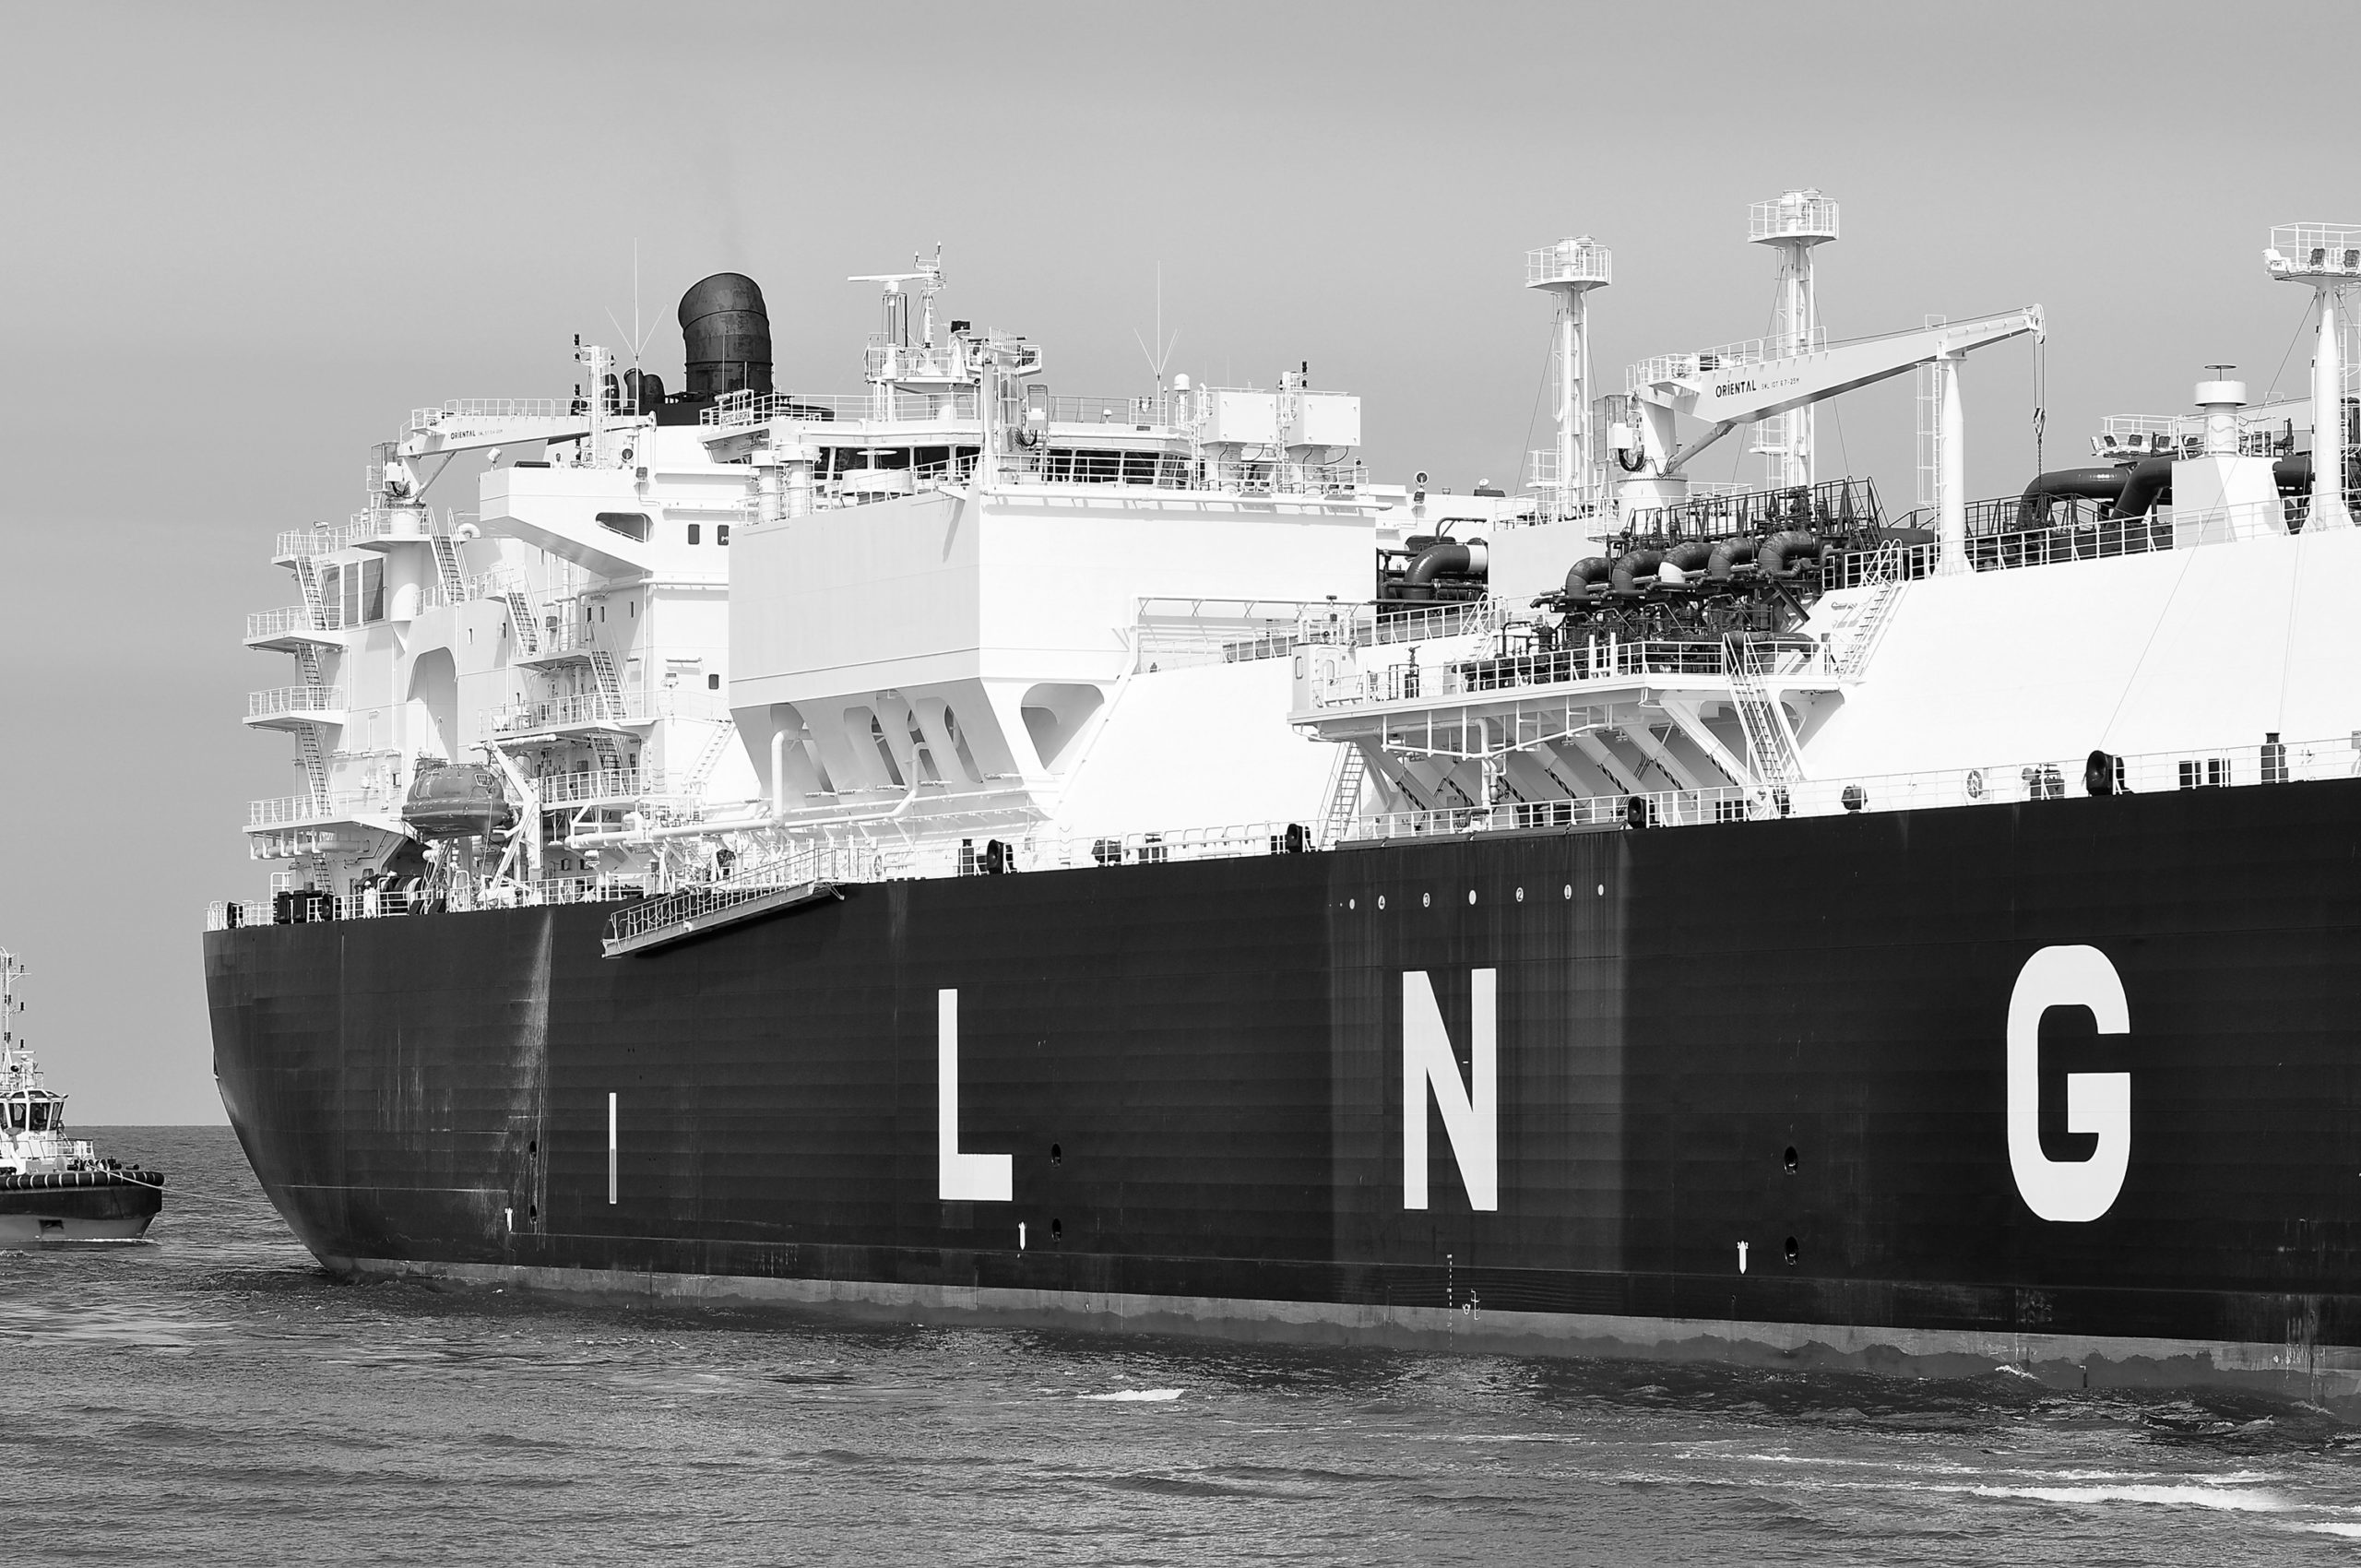
- LNG flows: LNG is flowing back into Europe after being diverted to Asia across the summer. The positive arbitrage to Asia in Q3 has reversed in Q4. Asian demand for spot cargoes has weakened as buyers look well hedged into the coming winter. And a huge jump in shipping costs (200k $/day charter rates) has increased the cost of delivering LNG to Asia.
- Russian flows: Gazprom has auctioned just over 1bcm of incremental gas across Q4 via the Ukraine/Slovakia import route. This has helped to increase supply into European hubs and Gazprom has now announced a halt to further auctions in Q4.
The first two of these drivers illustrate the impact of global macro drivers on the European gas market.
The last three represent the practical mechanisms via which these macro drivers act on supply and demand balance and hub prices. Q4 price dynamics are a great case study of the 3 key hub price drivers we set out in our October article.
