European hub prices have roughly doubled since Summer 2017 from 5 to 10 $/mmbtu (15 to 30 €/MWh). Half of this price move has happened in a surge between Jul and Sep 2018. Hub prices are sending a clear signal that the European gas market is tightening fast.
Three key factors are driving current hub price behaviour:
- LNG flows: Asia is pulling LNG supply away from Europe, given continuing strong demand.
- Power switching: Rising coal and carbon prices are dragging up gas for coal switching levels in European power markets.
- Russian flows: There are currently constraints impacting the incremental flow of Russian gas into European hubs. We address these in more detail today.
These 3 drivers have been behind the surge in hub prices across the summer. Next comes winter, with an increased risk of demand shocks (e.g. cold weather) and supply shocks (e.g. infrastructure outages). The European gas market looks to be heading into its tightest winter this decade.
In this article we set out how these drivers are interacting to set hub prices at the margin. We also provide a framework with which to understand what could happen this winter, and the drivers of hub prices beyond.
How supply & demand are interacting to clear European hubs
The European gas market evolves around a network of interconnected hubs. The Dutch TTF sits at the centre of this hub network and is the key pricing benchmark. Prices across hubs are structurally converged on a forward basis. Price differentials between TTF and other hubs reflect variable transport costs, except during times of temporary constraints.
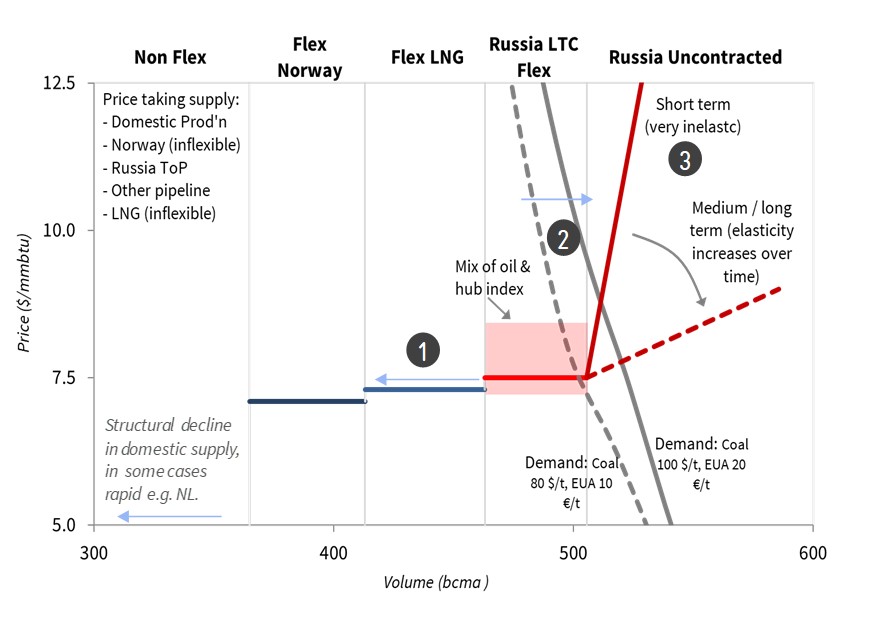
The interconnected nature of European hubs means that it is useful to take a step back when analysing price dynamics and consider the European gas market at an aggregate level. Chart 1 shows a simplified view of the pan-European supply & demand balance for 2019.
We have purposefully simplified the annual supply & demand balance view in Chart 1. Behind this lies a detailed country level build up of supply & demand in our European gas market model (which is linked to our global LNG market model & pan-European power market model). There are also a number of more complex considerations at the sub-annual level e.g. storage balances and seasonal production flows. But the advantage of this simplified aggregate annual view is that it allows a cleaner illustration of the ‘macro’ forces driving hub pricing.
Supply
The chart shows sources of European gas supply grouped into several key tranches:
- Non flexible price taking supply: consisting of (i) domestic production e.g. UK, NL, NO (very low variable cost) (ii) pipeline contract ‘take or pay’ volumes (ii) inflexible LNG contract volumes. These ‘price taker’ volumes flow regardless of hub price levels.
- Flexible Norwegian volumes: consisting of Norwegian production flexibility and flexible hub indexed contract volumes. These volumes are also effectively ‘price taking’ given Norway produces to an annual production target, but they are shown at a slight discount to current hub prices to reflect the fact that flows are seasonally profiled & optimised against hub prices.
- Flexible LNG volumes: made up of divertible European LNG supply contract volumes and LNG spot cargoes surplus to the requirement of other regions. Volume and flow depends on netback LNG spot price differentials relative to European hub prices.
- Flexible LTCs: Long term contract swing volumes above ‘take or pay’ levels, predominantly sourced from Russia (historically oil indexed but with rapid shift to TTF indexation), but also smaller volumes from other sources (e.g. North Africa).
- Uncontracted Russian flex: gas volumes that Gazprom can choose to flow into European hubs, or sell on shorter term basis (e.g. Q4 2018 auctions), given 80+ bcma of ‘shut in’ low variable cost production in Western Siberia.
A sharp reduction in Dutch production (Groningen earthquakes) and the impact of Asia pulling LNG away from Europe has shifted the European supply curve to the left in 2018, tightening the market. This has been exacerbated by a shift of the demand curve to the right as coal & carbon prices have risen.
Demand
Gas demand from the industrial, commercial and residential sectors is relatively unresponsive to price in the shorter term. In contrast, liquid power markets across Western Europe mean that gas demand from the power sector responds directly to gas market price signals.
The downward slope of the demand curve in Chart 1 reflects the potential for coal plant generation to ‘switch’ to gas plant generation across Europe as gas prices fall. Increases in coal & carbon prices shift the demand curve to the right (as shown in the chart). This is because for a given level of TTF, there is higher aggregate gas burn across Europe as the variable cost of coal plants increases.
The European gas demand curve has seen a major shift to the right since 2016. In 2016 & 2017 this was driven by an increase in coal prices (from 40 – 100 $/t), in addition to reduced French nuclear output & low Spanish hydro availability. The shift in 2018 has predominantly related to carbon (with a more than 250% increase in carbon prices across the summer to above 20 €/t).
The surge in hub prices since Jul 2018 is at the simplest level a function of the European gas demand curve being driven up a steep short term supply curve. What happens to hub prices across this winter and beyond, strongly depends on the responsiveness of Russian supply.
The importance of Russia
The current tightness of the European gas market focuses attention on Gazprom as supplier of the ‘marginal molecule’ into European hubs. It is Russian gas flow dynamics that determine the slope of the key last tranche of the supply curve intersecting with demand in Chart 1.
Gazprom has been ramping up its sale of incremental short term volumes in response to the Q3 hub price surge. At least 1.5 bcm of additional supply has been flagged for sale via auction in Q4. Gazprom has not indicated a cap on these auction volumes, so this number is likely to grow, particularly if TTF prices remain strong.
The Russian flow response to higher hub prices is impacted by a mix of strategic, commercial and logistical factors.
In the medium to long term (i.e. beyond 2019), it is not in Gazprom’s strategic interest to have TTF price levels at current levels around 10 $/mmbtu. Price levels above the Long Run Marginal Cost of new LNG supply (~ 8 $/mmbtu) are likely to encourage FID of new liquefaction capacity. Once new LNG projects are committed, they compete with Russia for market share.
However, in the short term (i.e. next few months) Gazprom has other commercial & logistical considerations in play. Two of the three main routes for Russian gas into Europe have hit maximum flow constraints across 2018 (Nordstream and Yamal). The third route via Ukraine is the focus of the Q4 Gazprom auction volumes and has some spare capacity (although it temporarily experienced daily flow constraints over the summer). But flows via this route are impacted by complex geopolitics between Russia, Ukraine and the EU.
Then there is Nordstream 2. The next 3 months are critical for EU approval of this 55 bcma new pipeline that can help grow Russian market share in the 2020s. In that context, capacity constraints and high hub prices are a convenient backdrop for Russia in trying to secure approval (& resolve Ukraine route issues).
What to watch this winter?
There are 5 factors worth keeping an eye on this winter, that are likely to drive the European supply and demand balance and hub prices:
- Coal & carbon prices: Further price rises will continue to shift the European demand curve to right, tightening the gas market and driving up TTF. Price falls will have the opposite effect.
- LNG flows: Market consensus expects Asia to continue to pull LNG away from Europe across this winter. But Asian buyers are likely to have higher levels of contract cover after the spot price pain of last winter. So it is not a forgone conclusion that all available LNG flows to Asia (e.g. Asian spot prices have fallen back towards TTF in October).
- Shocks: Weather is key to demand shocks, with the impact of prolonged cold snaps fresh in everyone’s minds after the ‘beast from the east’. Infrastructure outages tend to drive supply shocks (which are correlated to cold weather, particularly in the North Sea).
- Storage: European storage balances are lower than usual coming into winter (partly due to rising hub prices in 2018). The decline rate of storage inventories across the winter will determine the Q1 2019 buffer against shocks.
- Russian flow dynamics: Last and perhaps most important are the Russian dynamics we set out in the section above. The level of incremental Russian gas that flows into hubs will be a key driver of hub prices across this winter (& beyond).
The tightness of the European gas market across the current winter can be summed up by the balance shown in Chart 1. A steep demand curve is riding up a steep supply curve. Those are not conditions for price stability. If there is one thing to expect this winter it is higher hub price volatility.
Briefing pack: European gas market in transition
Timera Energy has just published a briefing pack on European gas market drivers & commercial implications. This covers:
- Analysis of tightening European & global gas market balances
- Dynamics of 3 key current drivers of European hub prices (LNG flows, switching, Russian flows)
- Potential paths for hub prices, seasonal spreads & volatility
- Commercial challenges facing gas players given market transition (capturing asset value, portfolio construction, asset investment)
This pack can be downloaded here: European gas market in transition |