Switching dynamics of gas for coal plant has been a key theme of this blog. Power sector switching is one of three key mechanisms currently setting marginal prices at European gas hubs. The relative variable cost of gas & coal plants is also a key driver of European power price levels and price shape.
In this week’s article we use three simple charts to explore the evolution of the fuel & carbon components of German coal & CCGT plant variable costs. We then look at the evolution of the competitiveness of coal vs gas plants.
Rising coal plant costs
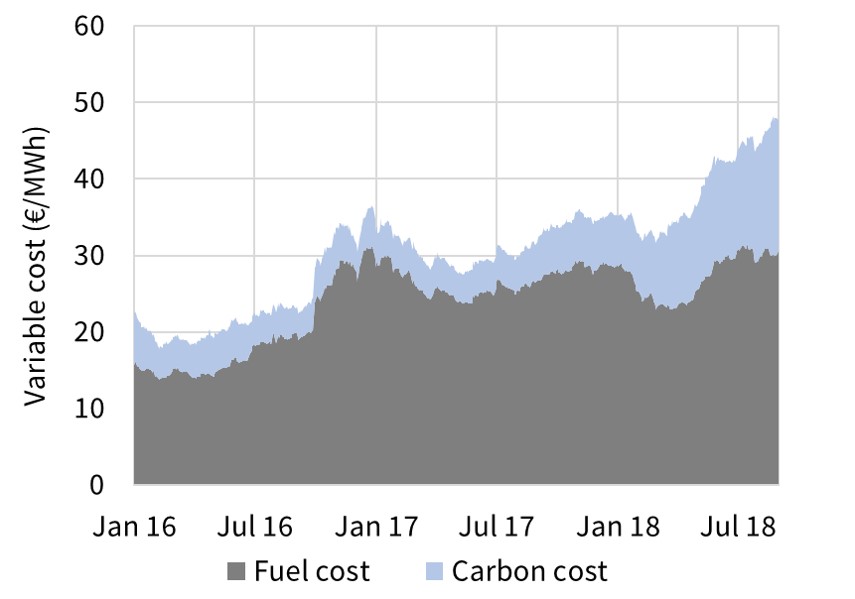
Chart 1 shows the evolution of the variable cost of an older German coal plant, split into carbon and fuel cost components. For simplicity variable O&M costs are not shown as they are relatively low (~ 1 €/MWh) and stable over time.
European coal prices have doubled since the start of 2016 (52 – 103 $/t). Most of this move higher happened in 2016 as can be seen in Chart 1.
The big increase in coal plant variable costs this year has been driven by carbon. EUA prices have risen 250% this year (8 – 20 €/t).
The combined impact of these price moves has been a more than doubling of coal plant variable costs since commodity prices bottomed in 2016. More than half that increase has happened in 2018. That is why power prices across Continental Europe have also soared this year.
Gas plant costs & switching levels
Chart 2 shows the evolution of fuel & carbon variable cost components for a newer CCGT plant in Germany. The black line overlaid on the chart is the total variable cost of the 40% coal unit from Chart 1.
There is a stronger seasonal shape to gas plant variable cost, driven by hub price seasonality. This means that CCGTs tend to be more competitive than coal units across the summer months.
As Chart 2 illustrates, there have been periods across the summers in 2016 & 2017 when there has been structural switching of newer CCGT units for older coal plants (shown with arrows). That has not been the case over the current summer.
In 2018, the impact of a sharp move higher in gas hub prices on CCGT variable costs, has outweighed the impact of higher carbon prices on coal plant costs. We explored the factors driving this move higher in gas prices in a recent article.
In Chart 3 we shift our focus to the future. The chart shows the gas vs coal plant competitive balance implied by current forward prices.
The move higher in gas prices this year has shifted the whole gas curve higher, although pronounced backwardation remains. Rising gas prices are increasing the relative competitiveness of coal vs gas plants (and causing a move higher in dark spreads).
But it remains to be seen whether this trend will continue. Switching is a naturally reverting process where as CCGTs are pushed out of merit, the associated fall in gas demand tends to weigh on hub prices. At the same time higher coal burn also feeds through into higher carbon emissions and EUA prices.
That is why, despite periods of temporary divergence, there is a strong relationship between the variable costs of coal and gas units.