The strategic value of European gas storage has become very clear across the crisis of the last two years.
“Value capture surged 5x in 2021… then 50% again in 2022”
Europe lost both supply volume and supply flexibility as Russia slashed its exports across the period between Summer 2021 and Summer 2022. Storage played a key role saving Europe last winter and continues to be a critical pillar of energy security of supply going forward.
The value of storage capacity has structurally changed as a result of the crisis. Some capacity owners have made huge returns across 2021-22. But these do not automatically translate into surging value for storage asset owners.
In today’s article we set out a backtest of storage value capture across the last few years, to illustrate the impact of the crisis driven market dynamics (in the context of preceding history). We also consider the implications of the post-crisis landscape for storage asset owners.
Backtesting storage value capture
We start by modelling a generic seasonal storage asset (180 day cycling time) with access to the TTF price hub. We use our gas storage optimisation model to analyse value capture from a rolling intrinsic strategy based on available forward price information across each day of the storage year. We assume modelled storage capacity starts and finishes the storage year with zero inventory (consistent with a one year storage contract).
Chart 1 illustrates the surge in value accruing to capacity holders as a result of the crisis in 2021-22. Note the chart shows storage years (which run from 1st Apr to 31st Mar).
The main drivers of the pick up in value in the last two storage years have been:
- Extreme price volatility given a tight market with elevated prices
- A breakdown in historical correlations across forward curve contracts.
It is particularly notable that value capture has soared despite extended periods of low intrinsic value (i.e. structural backwardation in forward prices and weak seasonal spreads).
Backtested value capture soared by a factor of at least 5x in 2021 relative to previous years. Particularly extreme volatility in 2022 then saw a further 50% rise in returns relative to 2021. 2022 returns were helped by the market moving into steep contango into last winter.
These backtesting exercises are useful for analysing key drivers of storage value capture. But there are some important practical considerations that can substantially impact the actual value capture of specific assets. These include:
- Poor forward market liquidity resulting in wide market bid / offer spreads (particularly acute in 2022)
- Inability to execute transactions at published market price quotes, particularly during periods of extreme volatility
- Constraints on market access due to margin costs, collateral requirements and capital constraints
- Individual asset inventory constraints, such as inability to inject or withdraw given physical or policy driven constraints (e.g. storage volume mandates – which have not been consistently implemented across markets & asset types).
That said, there were some trading desks that accrued huge returns from storage capacity optimisation across the 2021-22 crisis period, albeit often offset by substantial losses in other areas of their business.
Lifting the hood on storage value capture
A lot of the value capture opportunities across 2021-22 relate to monetisation of volatile prompt price spreads across the forward curve. These include e.g. the spreads between Day-Ahead, Weekend, Month-Ahead & Quarter-Ahead contracts.
Many of these value capture opportunities are realised by value capture from ‘rolling intrinsic’ driven trading churn of forward contracts to capture spread volatility. This trading activity can drive substantial value uplift above the returns from physical optimisation of injection & withdrawal.
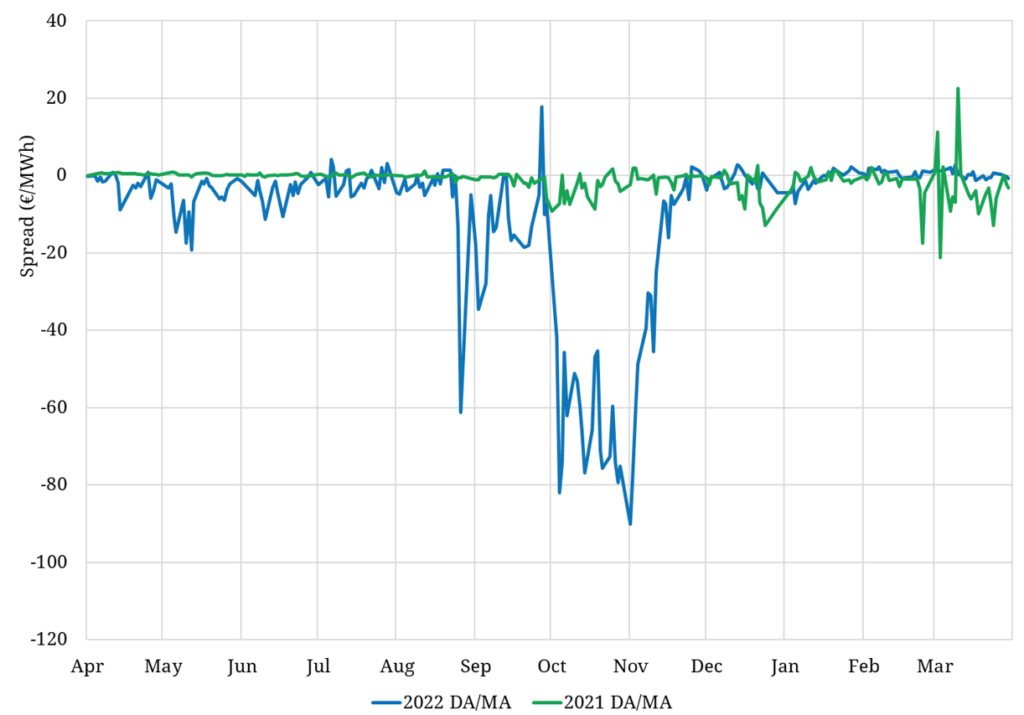
We illustrate this spread volatility in Chart 2 which shows the evolution of Day Ahead vs Month-Ahead price spreads. It is not hard to pick where the crisis began in Q3 2021, where the relatively docile green line starts to whip about like a snake.
The exceptional nature of 2022 is illustrated by the blue line. Not only were price spreads consistently subject to extreme volatility, a structural contango opened up across Q3-Q4 2022.
This reflected the market pricing in an extreme risk premium on a forward basis (e.g. Month-Ahead), relative to a much more sanguine near term supply situation (e.g. at the Day-Ahead). But we reiterate our points above here on practical constraints that some capacity holders faced in monetising these spreads (e.g. due to inventory, liquidity or market access constraints).
Storage is the natural supply response mechanism to address to these large distortions in market price signals. The fact that price signals became so distorted reflects the fact that most capacity holders faced constraints in being able to respond.
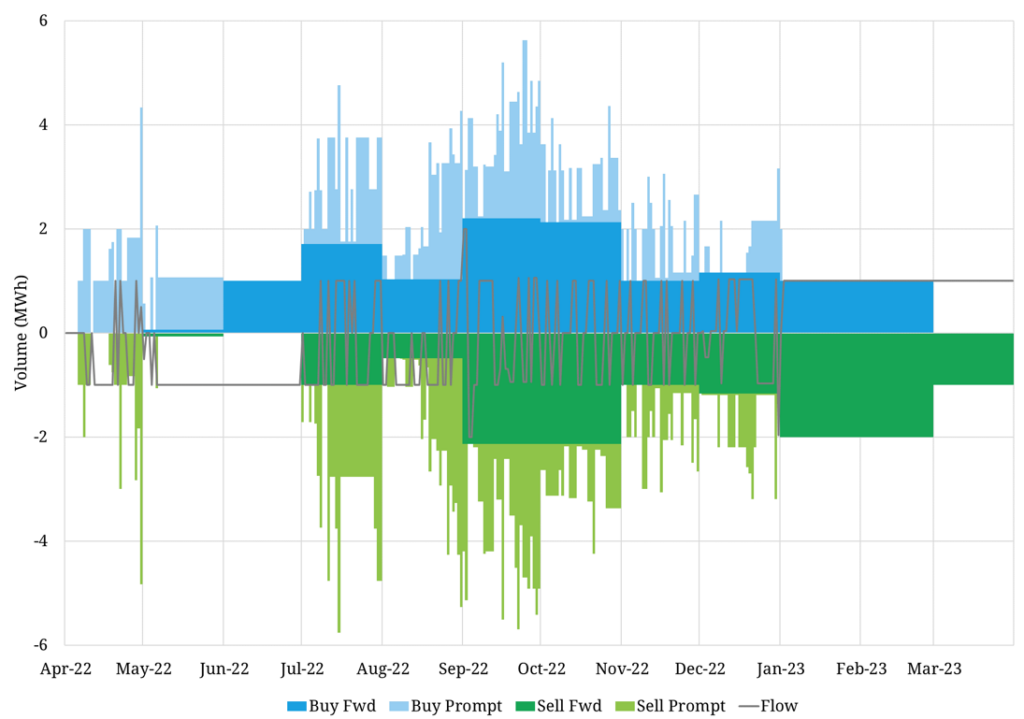
Chart 3 shows the physical flows of the modelled storage facility as well as the prompt and forward hedging activity executed as part of the rolling intrinsic strategy we modelled.
This illustrates just how important forward trading activity is in capturing the value from high price volatility and breakdown in forward contract correlations. The shorter term nature of this prompt trading helps to reduce the collateral & margining burden required to capture value (vs e.g. trading of seasonal & quarterly contracts).
It is worth noting that the physical inventory in our backtest is broadly consistent with the EU storage mandates, but these mandate constraints can in practice erode margin on individual assets.
Challenges for storage asset owners
The backtesting analysis above illustrates the shift in storage value capture dynamics in a post crisis market. Capacity value continues to be supported in 2023 by a large structural discount in summer vs winter price spreads.
A substantial portion of storage value capure is currently being monetised via within year cycling and trading activity. The traditional storage operator approach of selling capacity at a fixed price ahead of the storage year, sees this value accrue to the capacity buyer not the storage asset owner.
Part of the value accrual to capacity buyers reflects the risks borne by the buyer and the trading overheads required to monetise capacity. But there are ways that storage operators can adapt their capacity sales strategies to enhance value capture in post crisis market conditions, recognising changes to buyer requirements and risk appetite.
These include holding back capacity to sell nearer to delivery, adjusting contract pricing structures and embedding value sharing mechanisms within contracts. Storage operators are also adapting to a changing & uncertain policy environment e.g. evolving mandate landscape & changing TSO capacity tariffs.
We have seen a significant uptick in storage operators engaging us to work with them on refining capacity sales strategies across the last year.
Storage owners are also facing important strategic considerations as to the role & value of storage flexibility evolves quickly with fundamental market conditions. Key factors here are the impact of much higher LNG imports, the development of large volumes of new regas capacity and the changing nature of power sector flexibility requirements.
These changes underpin a requirement to reassess and refine the commercial strategies of storage asset owners to adapt to a post-crisis market.