The 2019-20 period has been a case study in how the LNG market drives European gas prices. Surplus cargoes flooding into Europe have seen gas prices plunge in order to induce adequate switching response from power markets. This is in turn dragging down power prices with widespread implications for power asset returns & investment economics.
“These ‘new wave’ FIDs represent big bets on the ability of the global energy market to absorb substantial volumes of LNG.”
These co-dependent ‘LNG → European gas → European power’ market dynamics are increasingly driving energy asset value & risk. In that context, we take a look at the supply side of the LNG market in today’s article by:
- Recapping the current wave of LNG that is buffeting markets in 2020
- Setting out the relative hiatus of new supply from 2021-24
- Considering the next wave of supply that is currently being locked in to come online from the mid 2020s.
The impact of this next wave will be important for determining not only the LNG market balance, but dynamics in European gas & power markets as well.
The Current LNG Wave
Strong LNG demand growth in Asia from 2010, boosted by the Japanese Fukushima disaster in 2011, instigated a wave of new LNG Final Investment Decisions (FIDs) across the first half of last decade. These included Australia, Cameroon, Russia (Yamal) and USA (Sabine Pass, Freeport, Cameron, Corpus Christi, Dominion Cove Point, Elba Island).
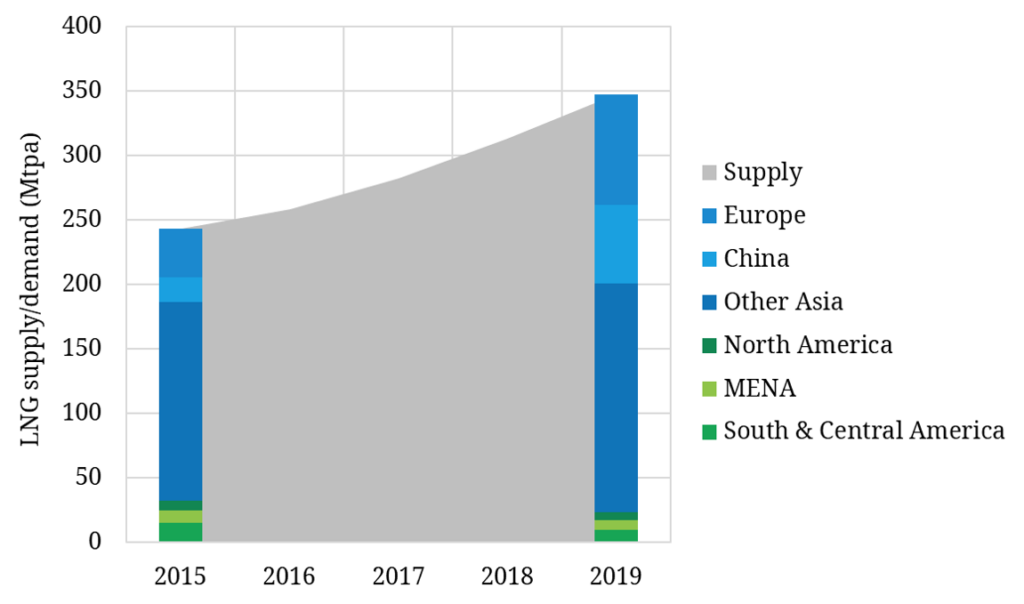
The investment in the current wave of new LNG supply was fuelled by the anticipation of further strong Asian demand growth. Global LNG supply between 2015 and 2019 increased by 43%. In this period LNG demand:
- Declined by 27% in the Americas and MENA
- Increased by a blistering 215% in China
- But increased by a much weaker than expected 15% in Asia (excluding China)
- Thereby causing a substantial increase in surplus cargoes to Europe (demand increasing by 126%)
This is illustrated in Chart 1 which shows the breakdown of global LNG demand in 2015 vs 2019.
The shortfall in Asian demand growth and surplus LNG cargoes flowing to Europe has in turn driven down Asian & European gas prices towards US Henry Hub price levels.
The 2015-18 investment hiatus
Investment in LNG supply infrastructure is strongly cyclical. This is driven in large part by a time gap of 4 to 5 years between FID and first production. This makes it difficult for players to predict at the FID stage, what market conditions will be like when supply comes online.
After the substantial volumes of new liquefaction FIDs across 2010-15, commitments to invest in new supply dried up from 2015 to mid 2018. FIDs were announced for Elba Island in 2016, Tangguh T3 in 2016 and Coral South (Mozambique) in 2017. But these represented a substantial decline in committed new supply volumes across this period.
This was partly due to weaker Chinese demand in 2015 and oil and gas price weakness in 2016. But it also related to a shift in the investment & contracting models of new supply projects.
Prior to 2015, Asian buyers favoured long-term LNG contracts on security of supply grounds. Upstream project investors (particularly mid-sized E&P companies) were also in favour, as long term oil-indexed sales contracts allowed them to raise external finance.
But across the last 5 years, the LNG market has transitioned to shorter term contracting, with buyers much less willing to commit to long term oil-indexed contracts. This contributed to the investment hiatus across 2015-18 as liquefaction projects were forced to adapt to new market conditions.
The new wave of LNG that has taken shape from mid 2018 has been driven by a transition from the project finance model to a greater dependence on large balance sheet backing. The companies involved are allocating LNG to portfolios rather than direct to buyers.
This leaves upstream LNG suppliers in the position of having to make large investment decisions on the basis of global LNG demand growth forecasts.
The new wave of LNG supply
Despite the uncertain global LNG demand growth landscape, we have seen a surge in new LNG project FID’s since summer 2018.
This started with Corpus Christi T3 and Yamal T4. But the new wave really gathered pace with the unexpected FID for LNG Canada (14 mtpa) in late 2018. This appeared to catalyse a flurry of subsequent ‘pent-up’ FID’s:
- BP Geater Tortue (Senegal/Mauritania) – 2.5 mtpa.
- USA Sabine Pass T6 – June 2019 – 4.5 mtpa
- USA Golden Pass – Feb 2019 – 15.6 mtpa
- Anadarko Mozambique – June 2019 – 12.8 mtpa
- USA Calcasieu – Aug 2019 – 10 mtpa
- Russia – Arctic LNG – Sept 2019 – 19.8 mtpa
- Nigeria T7 – Dec 2019 – 8 mtpa
In addition to these, Qatar is purposely moving towards launching 4 to 6 new trains (32 mtpa). While there has been no ‘defiinitive’ FID announcement, the Qatari’s have the lowest cost base globally which means these trains are a question of ‘when’ not ‘if’.
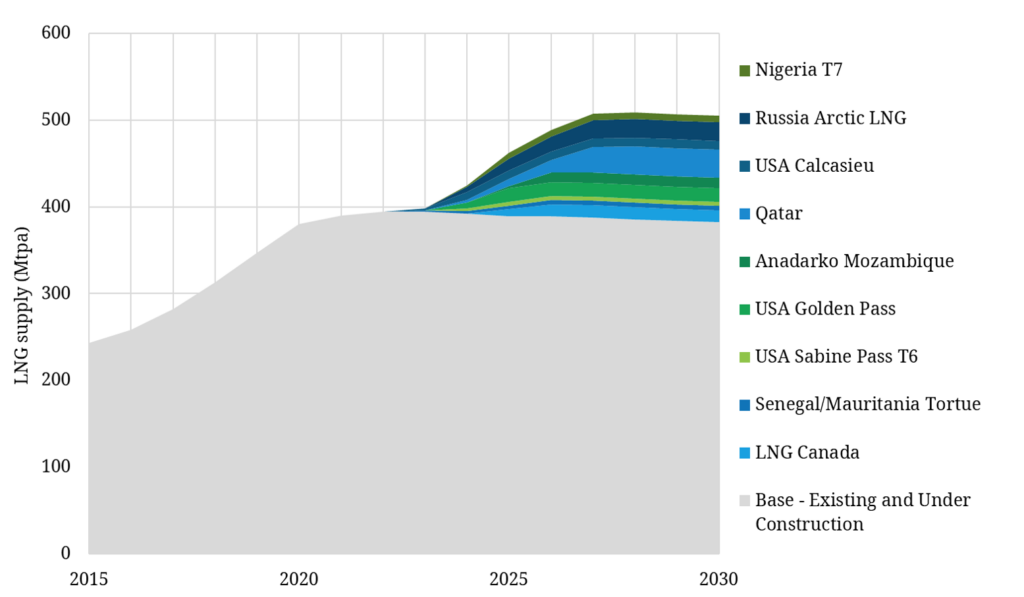
Chart 2 illustrates the impact of the 2015-18 investment hiatus as well as the impact of supply volumes from recent LNG FID’s.
After taking into account realistic project schedules, commissioning output build-up curves, historic supplier country performance vs nameplate and the decline in older liquefaction facilities, the expectation is that the ‘next wave’ will start to ramp up in 2024 and may reach 509 mtpa in 2028. This is a 47% increase from 2019, the equivalent of 162 mtpa.
These ‘new wave’ FIDs represent big bets on the ability of the global energy market to absorb such volumes of LNG. To a large degree these were made on the basis of the resurgence in Asian (end especially Chinese) LNG demand growth across 2015-18. But weaker Asian demand in 2019 and the threat of the coronavirus is creating increasing uncertainty about demand growth, at least in the short to medium term.
Boom bust volatility likely to continue
We set out recently our logic behind why we may see a trough in the current global gas market cycle across summer 2020. Just under 50 mtpa of new supply is coming online in 2020. But the impact of the 2015-18 investment hiatus kicks in sharply from next year, with new supply dropping to just 10 mtpa in 2021 and 4 mtpa in 2022.
On the demand side there have historically been weak individual years for demand growth e.g. 2019 and Chinese led weakness in 2015. The impact of the coronavirus does not bode well for 2020. However so far demand has bounced back after weak periods and there have not been prolonged consecutive year periods of weakness.
If demand recovers into 2021 against the backdrop of declining new supply, the LNG market could swing back quite quickly into a tight phase. Yet market consensus appears to be increasingly discounting the probability of this ‘boom’ scenario given current oversupply.
From the mid-2020s the volume impact of the ‘new wave’ of supply will kick in. In the absence of a sustained recovery in Asian demand growth, this may be the foundation of the next bust.