The European gas market experienced one of the most savage swings in global commodity market history on Oct 5th 2021.
“Massive margin calls and position liquidations took place”
With the market spooked by a rapid decline in Russian gas flows via the Yamal route, Winter 2021 prices opened above 100 €/MWh, gapping higher from the previous close. Then in the space of two hours prices surged 60% to 160 €/MWh.
This price move was literally off the charts compared to TTFs entire historical price range since inception. European gas was trading at over 40 $/mmbtu, about 8 times the level of US gas prices.
Without going into detail on the players involved, there were massive margin calls and position liquidations that took place. It is a testament to the resilience of the European gas market that it took such huge volatility in its stride.
We summarised the factors driving European gas & power prices higher a couple of weeks ago and nothing structural has changed here. Today we focus on what is happening with the two key market price signals for gas supply flexibility: seasonal price spreads and spot price volatility.
Front year seasonal spreads plunge to record low
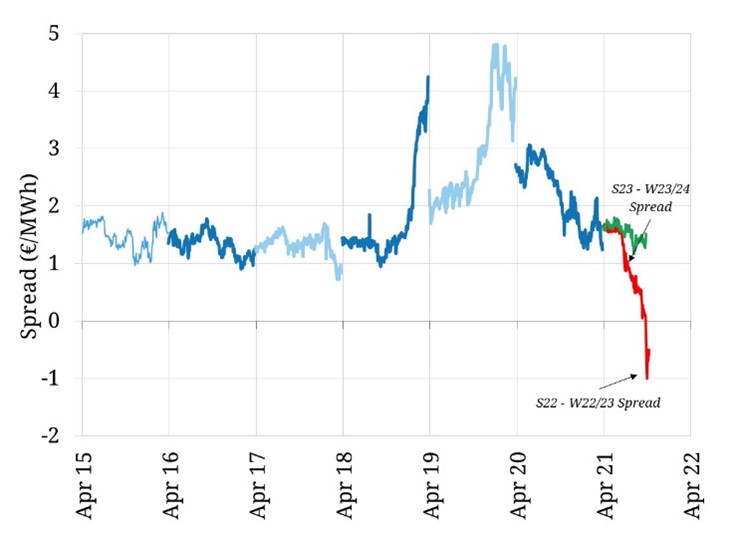
In Q1 2020, seasonal spreads hit their highest level in over a decade (almost €5/MWh). 18 months later the front year spread (Summer 22 vs Winter 22) is at a record low & pushing into negative territory (currently around -€0.5/MWh ) as shown via the red line in Chart 1.
The downward trend in Year + 1 spreads has had a very limited impact on Year + 2 spreads (Summer vs Winter 2023) spread which have remained around 1.5 €/MWh (green line in the chart).
The strange phenomenon of negative Year + 1 spreads reflects the acute tightness across the front of the TTF gas curve, which is acting to drag up Summer 2022 prices (particularly in April). The large premium in Winter 2021 prices is spilling into Q2 2022 as the market anticipates supply issues extending.
Storage levels are likely to be very low by the end of winter and there is significant Norwegian maintenance scheduled in Q2 2022 (with continuing backlog issues due to Covid). Gas demand remains strong and flexible LNG supply is being diverted to higher priced markets. It is likely to take significant incremental Russian gas via Nordstream 2 to cool the market.
Spot price volatility is surging
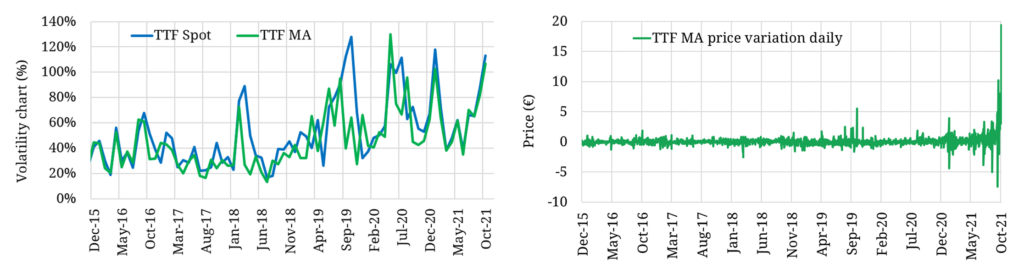
As front year spreads head south, TTF spot price volatility is exploding. The left hand panel of Chart 2 shows a significant surge in price volatility in % terms since the summer. But this needs to be considered against the backdrop of at least a ‘5 x’ increase in forward prices since earlier in the year.
In other words a 100% price volatility level is acting on an underlying price that is five times higher. This is represented by the second panel of Chart 2 which shows the path of absolute price deviations.
The recent surge in volatility is the second for 2021, after the Asian LNG driven price spikes in January. The market may not be paying for seasonal flex in the front of the TTF curve, but it is certainly paying for short term deliverability flex.
What do market moves mean for gas storage capacity
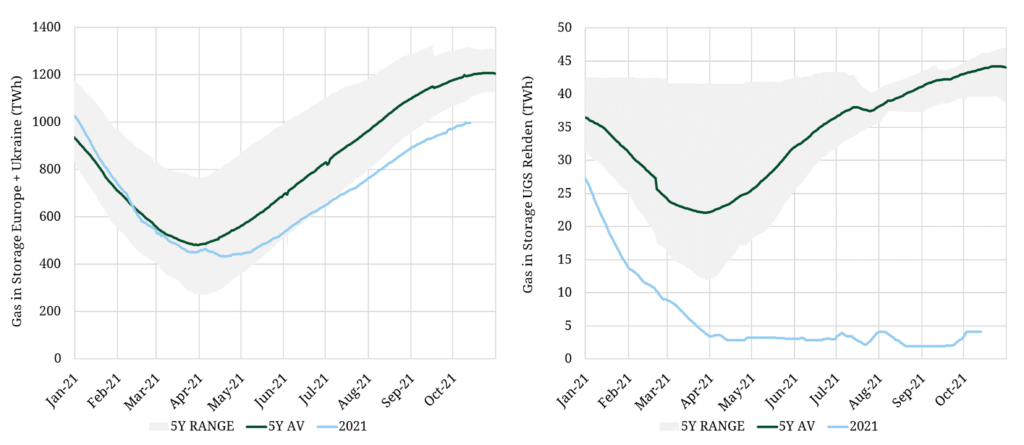
Gas storage is playing a central role in the current market turmoil. For a combination of economic and strategic reasons, European storage capacity holders have been restocking inventories at a very slow pace, as shown in the left hand panel in Chart 3. This is particularly true of storage facilities used by Gazprom e.g. Rehden shown in the right hand panel which essentially remains empty after last winter.
The intrinsic value of storage capacity has been a victim of a very flat TTF forward curve in 2021. But extrinsic value of capacity has surged with price volatility.
Fast cycle storage facilities are ideally placed to capture value from market volatility. Seasonal facilities may be slower to cycle but are relatively large in size and are also able to benefit from higher extrinsic value capture as volatility surges.
Storage traders can also capture value from price correlations breaking down in the front of the TTF curve, as the gas market is buffeted by bouts of volatility. This allows the harvesting of value via re-optimisation of hedge positions (e.g. via rolling intrinsic strategies).
The flat TTF curve shape and lack of seasonal price differentials is also challenging the capacity sales strategies of gas storage facility owners. For example selling capacity on a seasonal spread indexed basis allows the storage owner to retain value upside from spread recovery (vs locking in zero intrinsic value).
The rapidly changing European gas market dynamics are also pointing to a change in ownership of flexible midstream assets like gas storage facilities. As we set out in a recent article, traditional infrastructure investors and not typically best placed to handle rising decarbonisation risk and an increasing contribution of extrinsic value.
As midstream assets change hands, it will be very interesting to see how long term access to gas supply flexibility is priced. The events of 2021 are showing that Europe strongly depends on midstream supply flexibility (as well as upstream molecules).