The volume of Russian exports to Europe across the next 6 months will be critical to resolving Europe’s current gas & power market stress.
“Gazprom retains leverage over the EU via its control over timing of storage flows into the market.”
In mid-October, President Putin flagged an increase in Russian gas flows to Europe once Russian domestic storage facilities had been restocked. Last Tuesday incremental Russian gas flows became a reality.
In today’s article we look at Russian flow dynamics and how they may impact European gas & power prices this winter and across the next 2 – 3 years.
Russian flows driving prices
Gazprom’s export volumes are the key driver of European hub prices this winter. This is because of the simple fact that there is very limited flexibility available from other supply & demand sources.
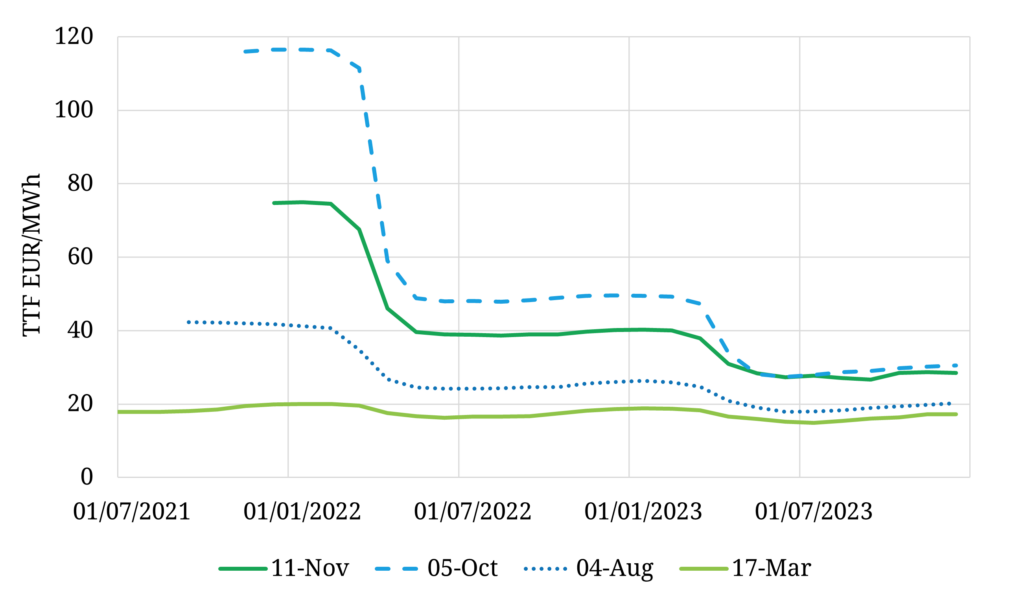
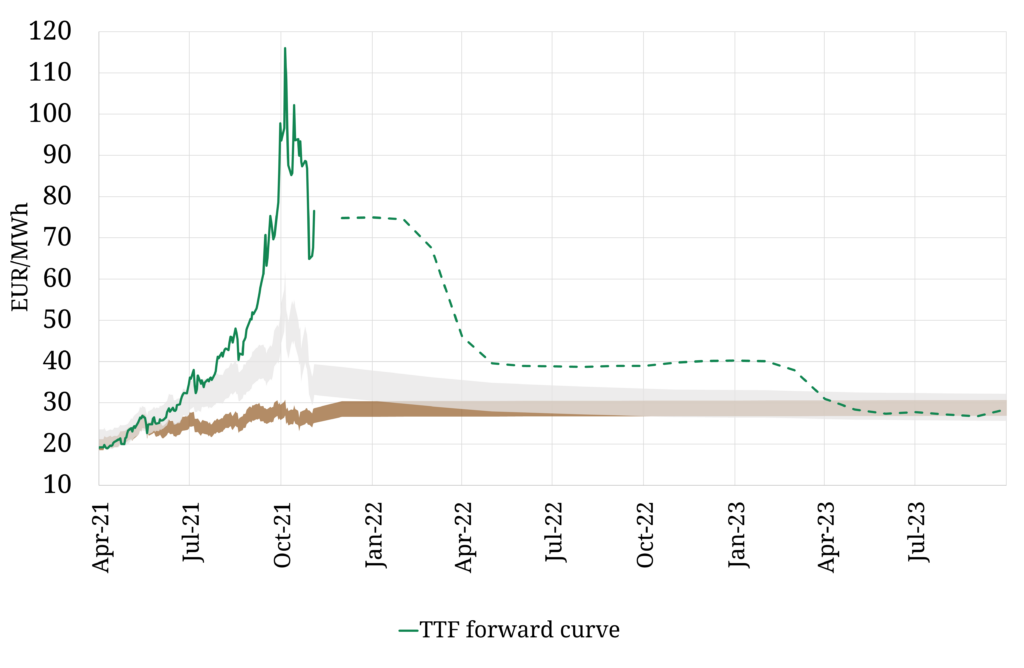
The impact of incremental Russian flows on TTF forward prices can be seen in Chart 1. The blue dashed TTF curve is from 5th Oct 2021, the day of peak panic that we described in our last article on European gas. The dark green line is the forward curve from late last week. Winter 2021 prices have fallen more than 40 €/MWh across the last 6 weeks (i.e. more than 30%).
Nordstream 1 is flowing at capacity. Nordstream 2 is tied up in a bureaucratic German & EU approval process that could last anywhere from 6 weeks to 6 months (see below). This leaves the market focused on incremental flow volumes via:
- the Yamal route through Poland (& the Mallnow entry point into Germany) and
- the Eustream route via Ukraine/Slovakia.
Gazprom’s long term capacity bookings at Mallnow (Yamal route) expired at the end of Sep 2021 and were not replaced with additional bookings. This was a big factor behind the early Oct price surge.
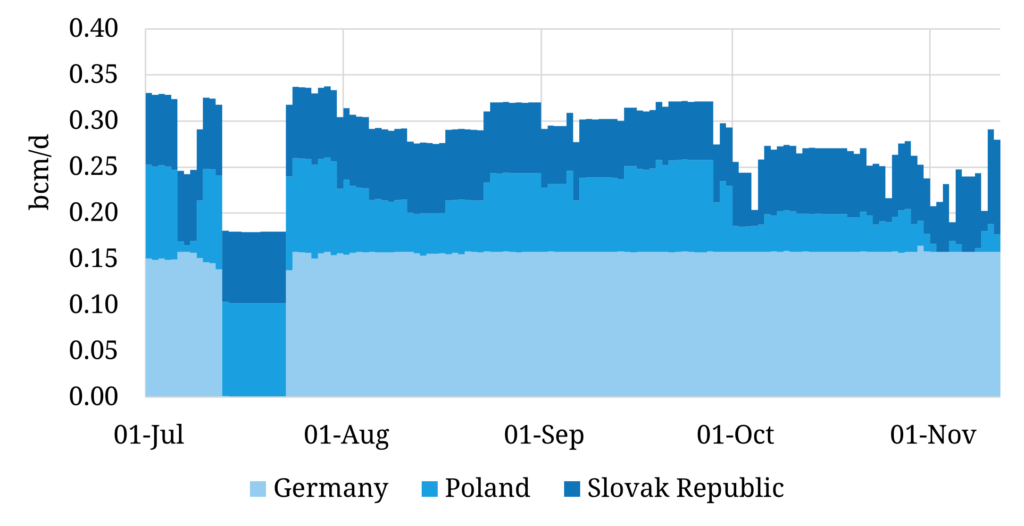
Gazprom flows via Mallnow increased last week for flows via these three key routes to reach the previously booked capacity level (~287mcm/d), with some smaller within-day bookings. These volumes are still down almost 100mcm/d from this time last year given long term capacity roll off & lack of spot sales via Gazprom’s Electronic Sales Platform (ESP).
Gazprom flows via Ukraine across the last few weeks have been flowing below ‘ship or pay’ levels under the new transit agreement. However flow volumes also increased on this route last week, back up to ‘ship or pay’ levels.
The increase in flow volumes across the two routes can be seen in the far right hand section of Chart 2, still short of pre-September levels but a step up since early October.
While these increases in flow volumes are moving molecules into the EU from behind the Russian border, the gas remains in Gazprom’s hands for now. Volumes are being injected into Gazprom’s 5 European storage facilities (e.g. in Germany & Austria).
However the way stored gas flows into the market is yet to be determined e.g. to meet customer nominations or to be sold onto hubs. So Gazprom has moved volumes closer to the hubs but retains leverage over the EU via its control over timing of its route to market.
For now the ramp up in flows is acting to dampen upside pressure on the TTF curve.
It’s not just Russia
Behind the headline focus on Russia there are several other factors in play:
- Storage: European inventories remain 19% below historical 5 year averages, reducing the storage flex buffer into 2022.
- Norway: NCS outages bit at the end of last week (a 60 mcm/d outage coincided with the increase in Russian flows). There has been a 1bcm increase in the Oseberg + Troll permit for 2021, but this is not enough to offset other decline in domestic European gas production e.g. from Groningen.
- LNG: Imports remain at multi-year lows as gas continues to be diverted to higher priced Asian & Latin American markets.
- Belarus: The Belarusian president Lukashenko has threatened to stop transit volumes via the Yamal route if the EU imposes sanctions, but this is unlikely to be a threat with teeth given the close relationship between Russia & Belarus.
All eyes are now on approval of Nordstream 2 (NS2) as the primary means of alleviating current market tightness.
Nordstream 2 state of play
The German regulatory authority BNetzA appears satisfied with technical integrity testing of NS2. It has requested information and assurances to support the NS2 Gazprom subsidiary qualifying as an Independent Transmission Operator and complying with EU regulatory requirements.
BNetzA has until January 2022 to approve NS2 after which time it submits its decision to the EC who have up to 4 months to approve. Finally BNetzA has a further 2 months before delivering a decision. This puts a fairly wide window of Jan to July 2022 for final regulatory confirmation on NS2.
The NS1 pipeline has a nameplate capacity of 55 bcma (though it has exceeded this slightly). Due to a regulatory restriction on the use of the OPAL ‘take away’ line, NS1’s capacity will be constrained to 44 bcma. Until now NS1 has avoided such a constraint by flowing gas vis a link line from OPAL to EUGAL (the NS2 take away line).
Once operational, If NS2 capacity is aligned with the EUGAL 80% firm capacity under the EU Capacity Allocation Management system, the effective usable capacity of NS1 and 2 combined would be some 88 bcma, ( i.e 33 bcma more than NS1 using some EUGAL capacity).
What is unclear at present is exactly how much ‘spare’ production capacity Russia has over and above recent export levels to Europe. The IEA has estimated some 15%.
What would it take to bring European hub prices rapidly back to pre-2021 surge levels:
- Gazprom export volume rates similar to 2018 or 2019, plus
- An additional tranche to offset underperforming domestic production and lower European LNG imports, plus
- a tranche to compensate for lower storage inventories (e.g. 20 bcm spread over 4 months).
Even with an early NS2 this looks to be a tall order.
The importance of power market dynamics
The other really interesting dynamic playing out is the power sector’s role (or lack of) in providing demand response flexibility.
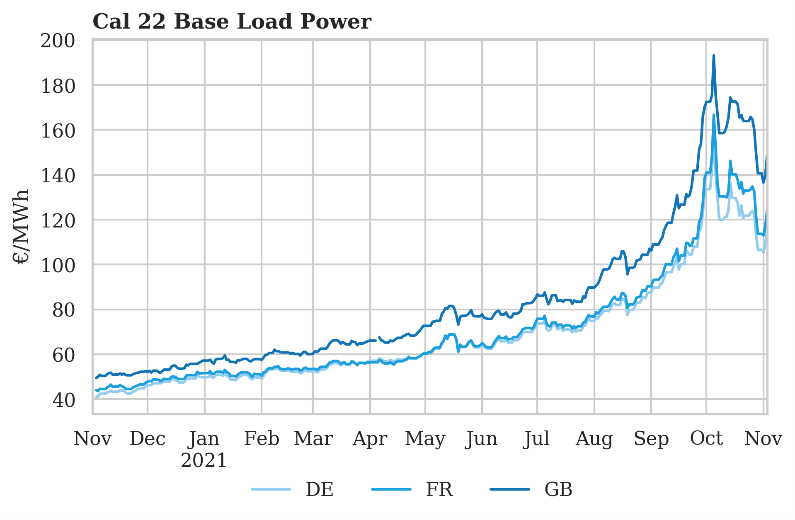
The 2021 surge in gas prices has fed directly through into power curves. Chart 2 shows a view of the German, French and GB Calendar 2022 power contract impact of the run up in gas (& carbon) prices in 2021. This illustrates the enormous price signal boost that higher gas prices represent for merchant wind & solar investors.
The early Oct peak in power prices coincides with the easing of conditions described above in the gas market. But what is interesting is that 2022 power prices remain disconnected from the gas vs coal switching range levels that have been a key anchor over the last 5 years as shown in Chart 3.
Not to be outdone by the gas market, European ARA coal prices have done a round trip doubling and then halving in the space of the last two and a half months. Coal prices for Dec 21 delivery surged from around 130 $/t at the start of Sep 2021, to over 260 $/t by early Oct, before crashing back to current levels around 130 $/t as China has eased domestic production restrictions.
As the fallout dust settles from this explosive coal price move, the TTF forward curve remains structurally dislocated from switching ranges until Q2 2023. This is effectively flagging a risk premium for ongoing gas market tightness across the next storage year.
It is likely we’ve seen the peak for gas prices this winter but don’t bet on a smooth transition back to normality. The interlinked European & global gas markets remain structurally tight, with strong Asian & European demand from recovering economies and multi-year lead times for new supply.