2018 was a year that confounded LNG market expectations of winter squeezes and summer lulls.
The market was tight over summer, with Asia pulling available cargoes away from Europe. At the same time, a carbon price induced rise in TTF helped drive Asian spot LNG prices to their highest levels of the year across the summer (~ 12 $/mmbtu).
Then as winter commenced, a surge of surplus cargoes flowed back into European hubs across Q4. Spot prices in Asia and Europe fell in sympathy, reconverging near 8 $/mmbtu by year end (see our 2018 surprises article for a chart and more details).
But behind the within year excitement of 2018, some key structural trends continue to define the evolution of the LNG market. In today’s article we take a step back to look at these trends across 5 charts that tell the story of the market supply and demand balance.
The LNG demand story
It’s all about China… isn’t it?
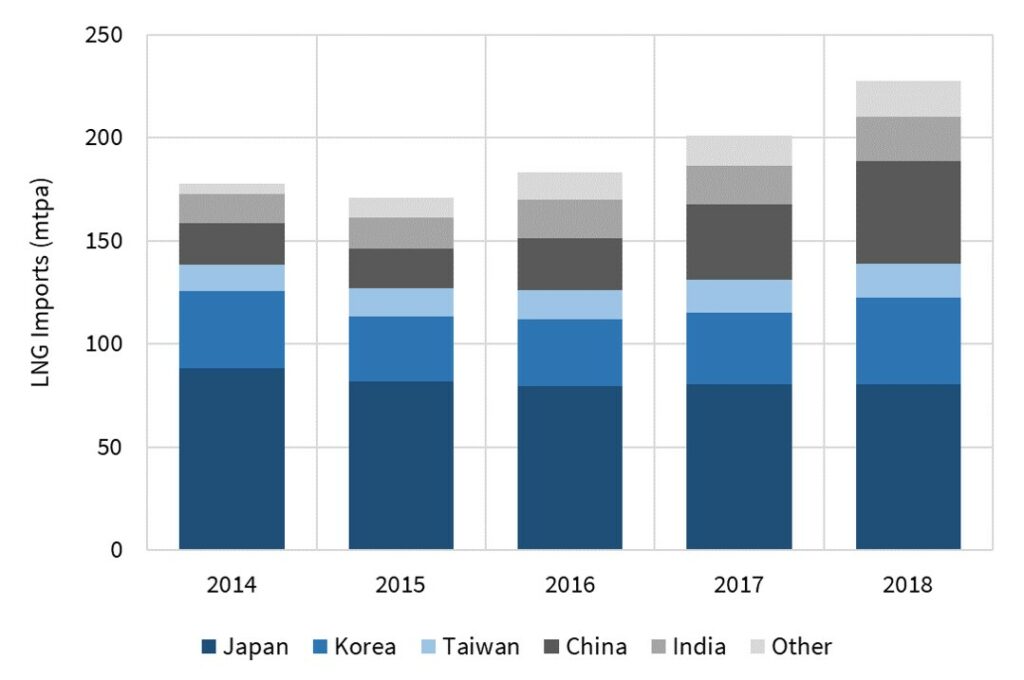
The most established structural trend in the LNG market is Chinese demand growth. China accounted for 61% of the 51 mtpa (69 bcma) of Asian demand growth from 2015-18, as shown in Chart 1.
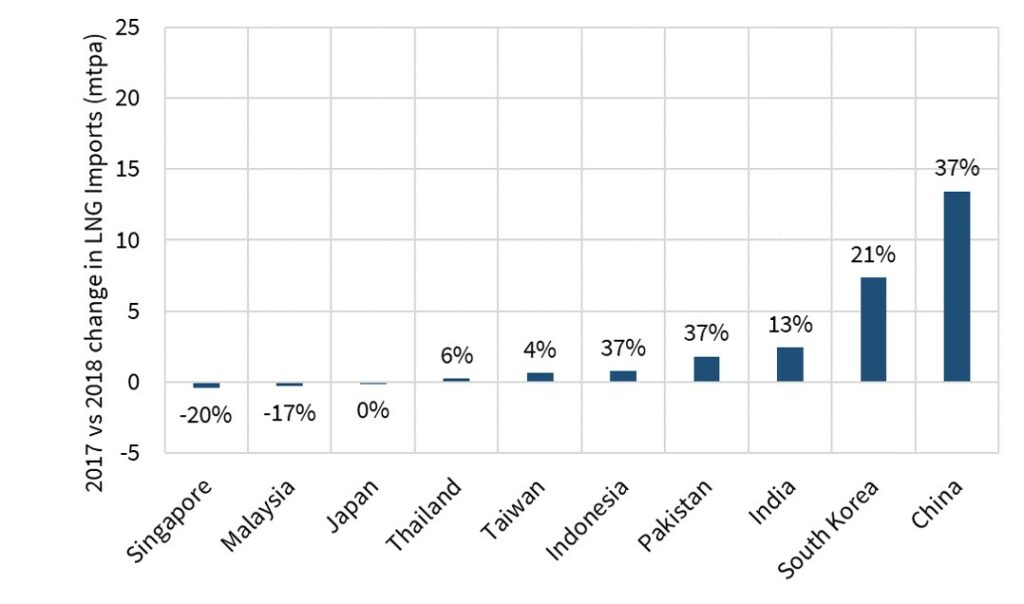
While Chinese demand growth continued at a blistering pace in 2018 (37% y-o-y), this actually represented a slowdown versus the two previous years. The less acknowledged driver of Asian growth last year was South Korea as shown in Chart 2.
South Korea had a 7.5 mtpa (10.1 bcma) increase in demand (21% higher than 2017), driven by a surge in LNG demand for the power sector given a series of nuclear shutdowns (as we covered in our recent Snapshot piece).
The Q4 surge in surplus LNG flows into North West Europe supported European demand growth in 2018. But this followed a European demand growth trend established in 2016-17 by:
- Iberian demand – helped by relatively low hydro balances lifting power sector gas demand
- Medditernean demand – with strong Turkish power sector demand and a pick up in Italian imports.
The LNG supply story
The supply side of the LNG market has less of a tendency to spring sudden surprises than the demand side. This is a function of the long lead times for delivery of new liquefaction projects (4 to 5 years). Aside from project delays, start-up teething troubles, outages and the occasional geo-political issue, supply side visibility tends to be pretty good.
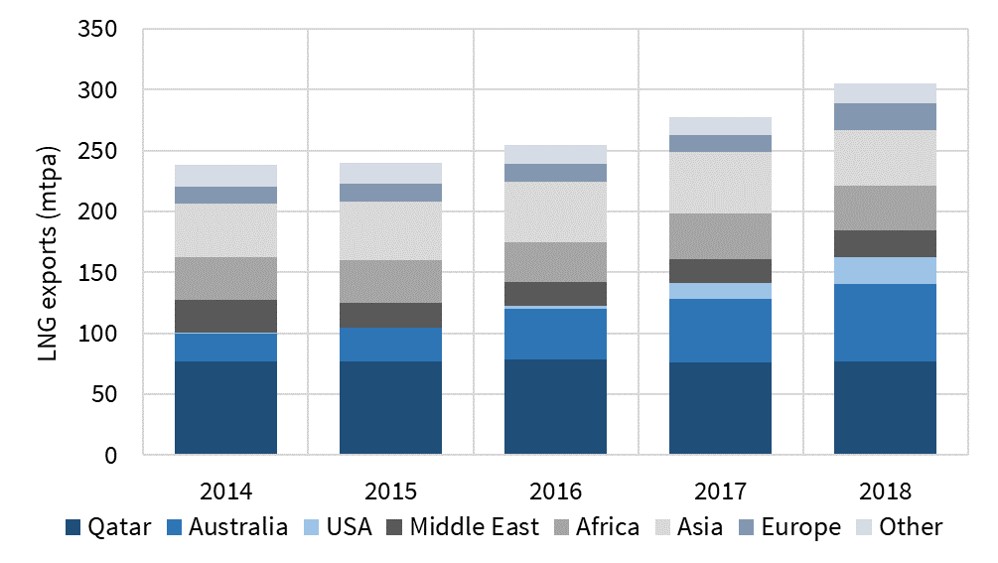
Chart 4 shows the ramp up in global supply from the current wave of new liquefaction capacity. About half of this 2016-21 wave of new capacity is now online, with large volumes of new supply focused in the 2019-20 period.
Three countries are dominating the current wave of new supply:
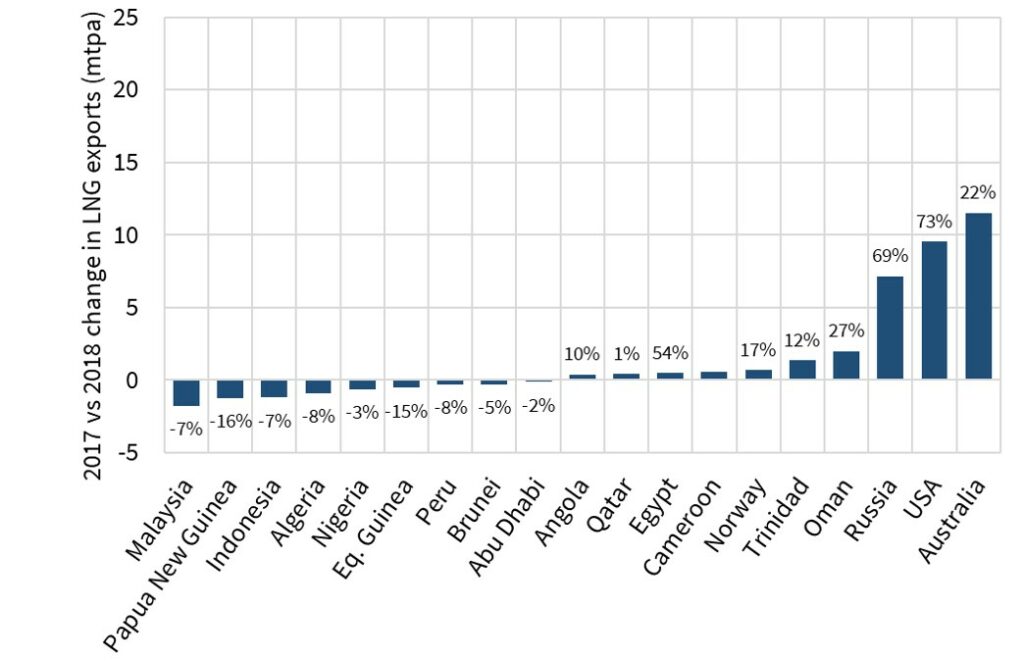
- Australia: doubling exports since 2015 to 64.6 mtpa (87.8 bcma) in 2018, with more to come this year
- US: exporting 22.9 mtpa (31.1 bcma) of LNG in 2018, with substantial additional volumes to follow in 2019-20
- Russia: with a healthy 17.8 mtpa (24.2 bcma) export growth in 2018
The importance of these three producing nations in contributing to 2018 supply growth can be seen in Chart 5.
Combining the supply & demand pictures for 2019
2019 may be a critical year in determining the path of LNG market evolution. A number of projects are queueing for Financial Investment Decisions (FID). These could join the Qatari expansion and the Shell led LNG Canada project to form the next wave of new supply (2022-25). Prospects looked good for a spate of 2019 FIDs until the cargo surplus and price slump of Q4 2018.
The combination of Asian and European demand growth comfortably kept pace with new supply over the last three years, until Oct 2018. Softening conditions in the LNG market since Oct have also coincided with a broader selloff in global financial markets, as evidence mounted of a significant slowdown in economic growth, particularly in China.
So 2019 is important for two reasons. Firstly in 2019 we approach peak delivery levels for new supply from the current wave or projects under construction. Any significant softening in demand this year may tip the market into a temporary (e.g. 1-3 year) period of surplus. Secondly the volume of new project FIDs taken in 2019 will be key to determining the LNG market balance in the 2023-25 period.
Somewhat counterintuitively, a temporary period of oversupply in 2019-20 which chokes off new FIDs, could well set up an uncomfortably tight market across 2023-25.
