‘There is an LNG glut’. ‘No, the market is tight’. Two tribes have emerged within the LNG market and their views are polar.
The glut tribe argues that LNG supply will outpace demand growth over 2018-21, forcing spot prices lower, potentially towards 4 $/mmbtu in order to shut in US exports.
The tight market tribe sees little evidence of oversupply, given demand growth is broadly keeping pace with new liquefaction projects coming online. It also points to a shortage of gas in the early 2020s due to a lack of investment now.
The key element that is often missing within this polarised debate is timing. If appropriate time horizons are defined, it is quite possible both tribes will be proven right. In fact oversupply over the next three years may be a powerful catalyst for a tightening market in the early-mid 2020s, as it chokes off liquefaction investment decisions.
New investment has dried up
Significant uncertainty around the level of Asian LNG demand has fueled the polarisation of industry views. It is generally accepted that cargoes which are surplus to Asian & Latin American requirements will flow to Europe. But the level of this surplus could quite credibly be anywhere from 15 – 70 bcma (10-50 mtpa).
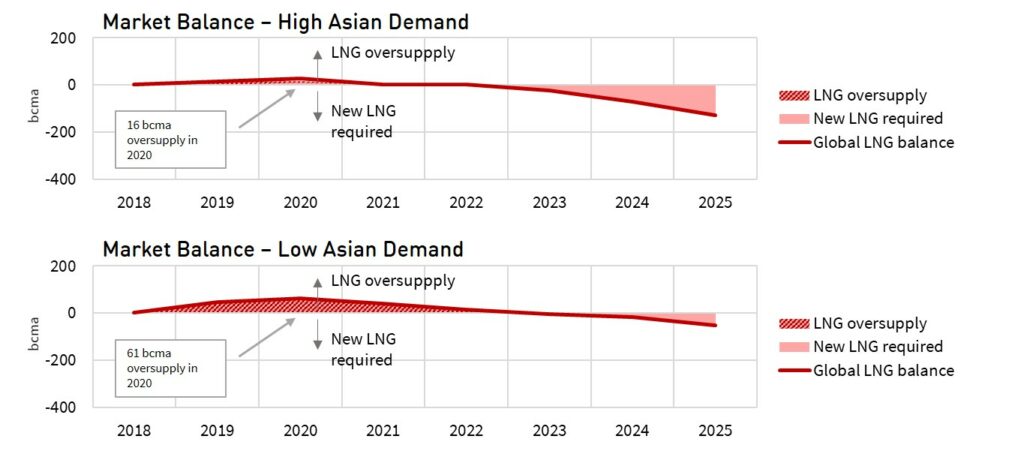
Chart 1 shows the global LNG market balance under an illustrative high and a low Asian demand scenario. The global surplus of LNG (vs business as usual demand) is shown by the hashed red area above the balance line. Beyond this, the global deficit of LNG is shown by the red shaded area below the line. The period in between surplus and deficit reflects the ability of Russian pipeline exports to temporarily meet incremental demand growth requirements with shut in West Siberian gas production.
The scenarios in Chart 1 illustrate both the time & volume range of global surplus LNG volumes that could flow to Europe depending on Asian demand growth:
- The top panel shows a more aggressive Asian demand scenario with only 16 bcma surplus flow in 2020 and new supply required by 2022
- The bottom panel shows a slower Asian demand scenario with 61 bcma of LNG surplus in 2020 and a requirement for new supply from 2024.
Volumes towards the lower end of this surplus range can be absorbed at European hubs in a relatively orderly fashion via power sector switching. Volumes at the upper end of the range are likely to force European hubs down from current levels (~ 7 $/mmbtu) to levels that shut in US export flows (~ 4.0-4.5 $/mmbtu assuming Henry Hub prices remain ~ 3.0 $/mmbtu).
This uncertainty is causing Financial Investment Decisions (FIDs) in new liquefaction capacity to dry up. There was only one liquefaction FID in 2017 – ENI’s Coral South FLNG project.
The next wave of investment looks to be some way off
Market uncertainty also means there are few credible prospects for FID in 2018. The winter surge in Asian spot prices supported some optimism in late 2017. But this was largely the result of a lack of seasonal storage in Asia, with prices quickly re-converging with European hubs in Q1 2018.
Cheniere is expected to make a decision this year on Corpus Christi Train 3 (cost advantage given existing infrastructure). Ophir’s Fortuna FLNG project FID was expected this quarter but appears to have been delayed by issues with financing. It is slim pickings for imminent FIDs beyond these projects.
Liquefaction projects typically have a 4 to 5 year lead time to full production. That means FIDs taken in 2018 are unlikely to impact global supply until 2022-23. Glut or no glut, the pace of new supply entering the market is set to accelerate over the 2019-20 period. This will likely keep a cap on LNG prices and new project FIDs.
So it may not be until the early 2020s that significant volumes of new investment are forthcoming. That is likely to be too late. The timing of Qatar’s decision to bring 20+ mtpa of low cost new supply to market will be key. But as things look today, the LNG market may be marching towards a major squeeze in the early-mid 2020s.
Winners & losers from an LNG price surge
The key losers from higher gas prices are consumers (residential, commercial and industrial). Retailers may also be hurt, to the extent they cannot pass through price rises e.g. for contractual, competitive or policy reasons. Gas-fired power plants would also likely suffer from an erosion of competitiveness versus coal plants.
A gas price surge would clearly benefit gas producers (although this is dependent on timing & offtake contract structures). A tighter market would also likely mean greater gas price volatility, paying dividends to owners of flexible midstream assets e.g. LNG portfolio players.
There would also be important knock-on impacts for European power markets. By the early 2020s, gas-fired plants will dominate marginal setting of wholesale power prices. That means higher gas prices translate directly into higher power prices (via CCGT pass through). That is good news for the prospects of standalone renewable development. But it may also prolong the economic lives of coal plants (depending on coal & carbon prices).

