Baseload power prices are becoming irrelevant. This is down to the simple fact that a diminishing number of power assets run to a baseload profile. Asset values are instead increasingly dependent on fluctuations in power prices close to delivery (‘prompt prices’).
The value of flexible assets, such as gas-fired power plants, hydro storage, batteries & demand response, is driven by prompt price shape and volatility. Value is created by dispatching asset flexibility to respond to fluctuations in prompt price signals, whether within wholesale or balancing markets.
The behaviour of prompt prices is also increasingly important for wind and solar assets. As renewable capacity rollout increases, so too does price cannibalisation. In other words, in periods when wind & solar output is high it is driving down captured prices.
In today’s article we look at the dynamics driving the evolution of prompt power prices, recognising the uncertainty created by fluctuations in wind output, solar output and demand. We do this by analysing the evolution of technologies setting marginal power prices across the day, using a UK power market case study.
Marginal price setting: a UK case study
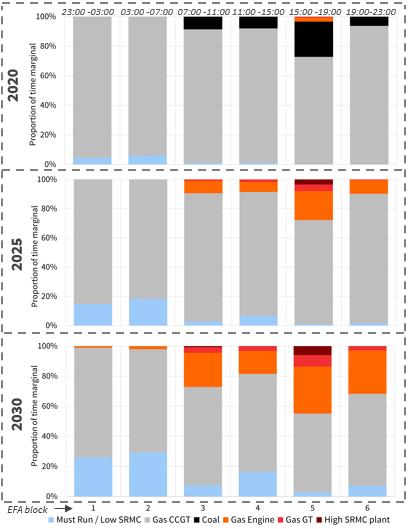
Chart 1 illustrates the evolution of the distribution of marginal price setting plant categories across different parts of the day as the UK market evolves from 2020 to 2030.
Analysis is built on a projected distribution of net system demand i.e. it captures the uncertainty associated with fluctuations in wind output, solar output and demand. This draws on the logic we set out in an article two weeks ago on modelling power market uncertainty.
The chart shows a projection of the percentage of time different technology types set power prices across the 24 hours of the day, aggregated into traded four hourly EFA blocks.
For example, the bottom panel shows that in 2030 in EFA block 4 (11:00-15:00):
- CCGTs set prices 65% of the time
- Low/zero variable cost plants (e.g. wind, nuclear) set prices 16% of the time (e.g. in periods of high wind & solar output)
- Gas peakers, batteries & DSR set prices 19% of the time (e.g. in periods of low wind & solar output).
Several key dynamics can be observed in Chart 1:
- Gas dominance: CCGTs continue to dominate UK marginal price setting through the 2020s, but with their influence being steadily eroded over time.
- Low renewables: In periods of low wind & solar output and high demand, high variable cost peaking capacity (e.g. engines, batteries, DSR) sets prices.
- High renewables: In periods of high wind & solar and low demand, low variable cost capacity (e.g. wind, solar, nuclear) sets prices at low or negative levels.
The analysis of evolution of marginal price setting plants allows us to draw some important conclusions on the evolution of price behavior over the next decade.
Conclusions on price behavior
- Support for peak prices
The retirement of coal & CCGT plants from the middle of the UK supply stack is set to increase the role of peaking flexibility (engines, GTs, batteries & DSR) in setting marginal prices. This peaking flex has higher variable costs than coal/CCGT plants, acting to support peak prices.
However, the evolution of peak price shape is also influenced by the pace and scale of shifting load shape. This depends on a combination of technology evolution (e.g. electric vehicle roll out, smart appliances & software) and the roll out of enabling infrastructure (e.g. across distribution networks).
- Downward pressure on offpeak prices
As wind & solar output volumes rise, so do the percentage of periods where low variable cost capacity (e.g. wind, solar, nuclear) set marginal prices at low or negative levels. This acts to drag down prices in these periods, which are more prominent in the lower demand offpeak hours of the day.
Reports of the death of gas price linkage have been somewhat exaggerated. CCGTs, gas engines and GTs will continue to dominate the price setting section of the UK supply stack well into the 2030s, even under high renewable rollout scenarios. But there will be a gradual erosion of price linkage over time, particularly of capture prices for wind and solar assets.
- Support for price volatility
The rapid rise in wind & solar output across next decade increases supply stack fluctuations. For example, we estimate 17GW wind and 14GW solar intraday swing ranges by 2030. At the same time a steepening of supply stack increases the price impact of wind/solar fluctuations i.e. output swings can tip market from negative prices to 100+ £/MWh in hours.
The impact of shifting load shapes & rising battery flexibility is outweighed by intermittency. For example National Grid estimates battery capacity in the UK to be 3-5GW by 2030. The flexibility provided by this is much smaller than wind/solar swing volumes. As a result, power price volatility is set to increase.
Confronting uncertainty
Power asset values are becoming increasingly dependent on price dynamics close to delivery. The resulting problem that confronts asset owners and investors is prompt price uncertainty.
Being able to understand this uncertainty is key to quantifying and managing asset risk/return. This problem is tackled by analysing the evolution of prompt price distributions, rather than relying on forecasts of baseload (& peakload) price levels.