The roll out of wind and solar capacity is transforming power markets across Europe. If you want to understand the practical impacts of high renewable penetration, Germany is a great place to start.
Renewable generation output contributed about 38% of gross German electricity consumption in 2018. The German market is particularly interesting because renewable production is dominated by intermittent sources:
- Wind: 59GW of installed capacity (53GW onshore, 6GW offshore)
- Solar: 45GW of installed capacity.
Wind and solar combined make up more than half of Germany’s 205GW of installed capacity, as well as dominating new capacity growth.
In today’s article we look at a Dec 2018 case study of swings in renewable output and their impact on German power prices. This is an interesting ‘lab experiment’ for much bigger things to come next decade.
The behaviour of renewable intermittency
Perhaps the most important impact of rising intermittency is its effect in increasing market uncertainty. Despite leaps forward in the ability to analyse weather data, it is difficult to predict wind & solar output tomorrow, let alone next month. The inherent uncertainty of renewable output is reshaping the risk/return profile of power assets.
Despite uncertainty, wind and solar output follow seasonal patterns that help define the range of output uncertainty. For example, current German generation output distributions show that:
- On sunny summer days solar output can reach nearly 30GW, but output rarely rises above 10GW in mid-winter.
- Wind output can reach 45GW in winter but rarely breeches 30GW across the summer.
These numbers can be compared to annual peak demand around 84GW (gross).
Wind output is a much greater source of uncertainty than solar. This is because wind speeds can ebb and flow substantially over the space of just several hours. For more details see our article on analysis of quantifying wind and solar output distributions.
But fluctuations in wind and solar output are only half the story. What is more important from a commercial perspective is the impact of these swings on market prices and plant load factors. That is well illustrated via a recent German market case study.
A December 2018 case study
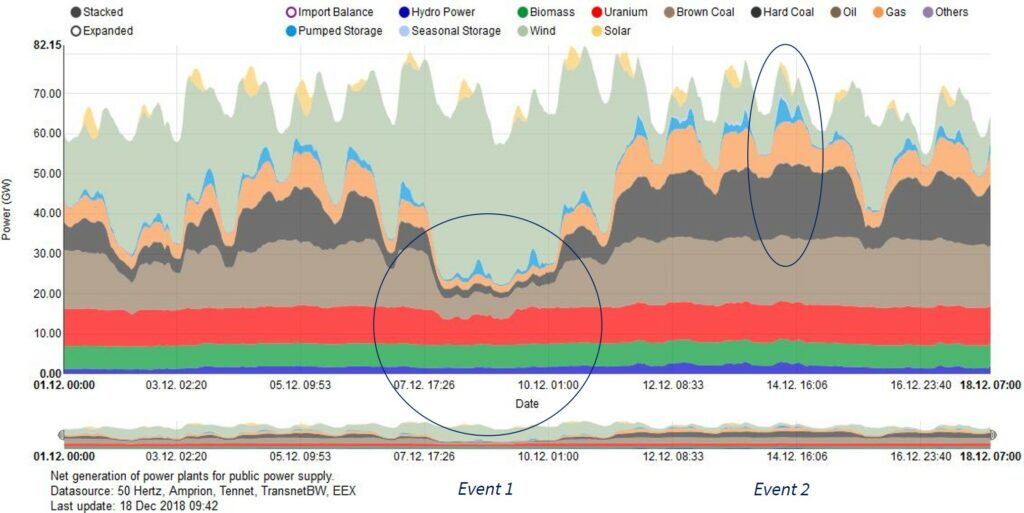
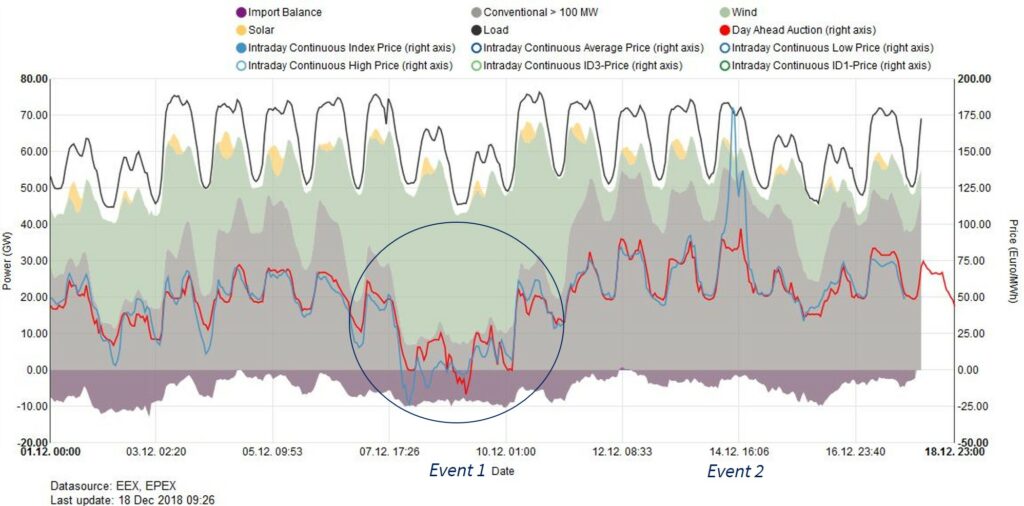
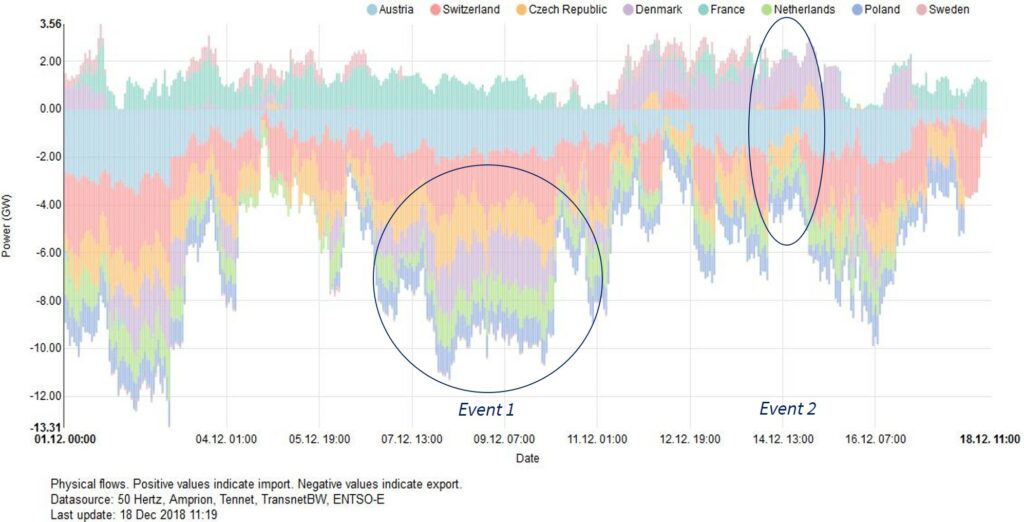
Chart 1 provides a summary of generation output (top panel), prices (middle panel) & cross border flows (bottom panel) in the German power market across the first half of Dec 2018.


