European LNG import volumes set another new record in Apr-19, following the previous record set last month. Volumes are up about 230% compared to this time last year.
In the face of an onslaught of LNG, Russia has not flinched. Import volumes from Gazprom in Apr-19 also set a new record.
A fascinating battle between Russian and LNG import volumes is shaping up across the next 3 years. In today’s article we look at two scenarios for European gas market supply & demand balance across 2019-21. We also consider the mechanisms available to absorb surplus LNG and how Gazprom may respond to lower prices.
European LNG imports depend on Asian demand
The more than doubling of European LNG imports since last summer is a function of global LNG supply outpacing demand growth. The resulting surplus of LNG cargoes is being absorbed by Europe’s liquid North West European hubs (TTF & NBP).
We have a pretty good view of supply growth over the next 3 years given this relates to liquefaction projects currently under development. The key uncertainty is the pace of growth in Asian demand.
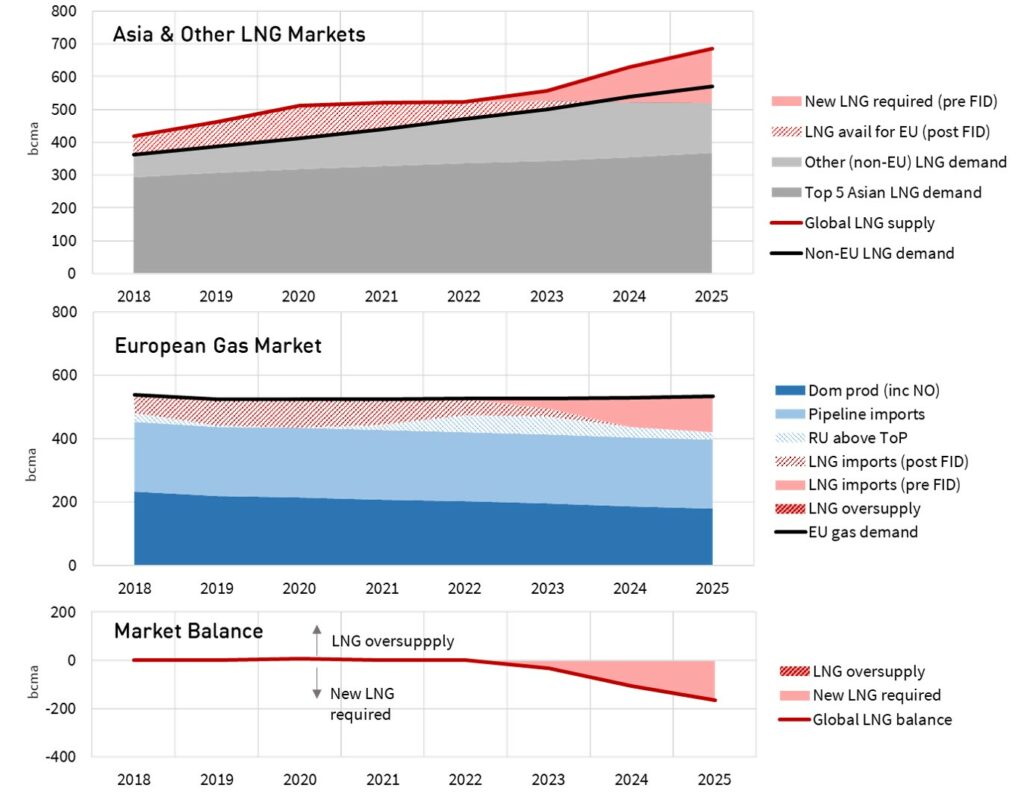
In Chart 1 we consider two scenarios for Asian demand growth across 2019-21. For simplicity we assume stable European gas demand at 2018 levels and net zero storage volumes across years.
The left-hand panel shows a high Asian demand growth scenario, the right-hand panel a low Asian demand growth scenario.
Under the high growth scenario (left hand panel), there is a surplus of around 25 bcma of LNG in 2019 & 2020 flowing to Europe. This surplus is largely gone by 2021 as the current wave of new liquefaction has effectively been absorbed by that point.
The LNG surplus flowing to Europe is significantly larger under a low Asian demand growth scenario. This year’s surplus is 41.4 bcma, with further growth to a 63 bcma surplus in 2020 (the peak delivery year of the current wave of new supply).
So which scenario path are we following? Up until Winter 2018-19, Asian demand appeared to be on a ‘high growth’ trajectory. But demand has been softer over the last six months, in part relating to warmer weather across winter. There has also been early evidence of a slowdown in economic growth in Asia. The extent to which this slowdown continues (or rebounds) will likely determine which path LNG demand follows across the next 2-3 years.
How will the European market clear surplus LNG?
There are 3 key mechanisms that enable the LNG market to absorb surplus volumes (vs ‘business as usual’ demand):
- European switching: As European gas hub prices fall, gas-fired power plants become more competitive relative to coal plants, boosting power sector gas demand.
- LNG demand response: As LNG spot prices decline, some buyers may increase demand (particularly emerging Asian buyers e.g. India). We estimate around 10 bcma of potential incremental demand.
- US shut ins: Ultimately if European & Asian spot price levels decline to levels such that netback prices in the US turn negative, then US LNG export flows will decline as a form of supply side response. Volume response here is substantial at ~55 bcma (40 mtpa).
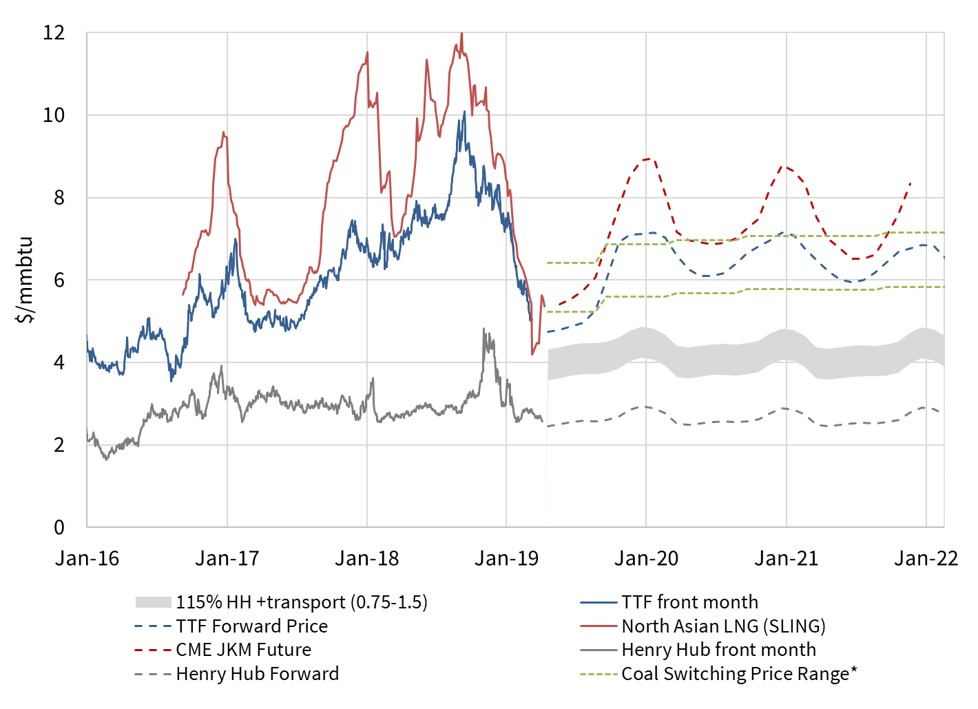
While there is upwards of 30 bcma of total power sector switching potential in Europe, this depends on relative gas, coal & carbon prices. Chart 2 shows an estimated switching range for German CCGTs vs coal plants. European hub prices in Summer 2019 are now well below that range, and power sector switching is already happening in significant volumes.
Chart 2 also shows our estimated shut in price range for US LNG exports, currently sitting around 3.55 – 4.30 $/mmbtu vs front month TTF prices around 4.72 $/mmbtu.
Given US shut in levels are approaching below, incremental power sector switching potential is likely to be limited before shut ins commence. This is particularly the case if coal prices continue to decline alongside gas prices. So, do not be surprised if significant volumes of US gas are temporarily shut in over the coming summer.
TTF forward curve prices however recover sharply from Winter 2019-20 (as shown in Chart 2). Market pricing is consistent with an acute oversupply of gas across the current summer, but a recovery beyond. In other words, the market appears to be pricing in a continuation of higher Asian LNG demand growth. If this turns out to be too optimistic, there may be more US shut ins required to clear surplus gas in 2020.
Russia vs LNG: who blinks first?
Gazprom has shown no inclination to pull back on European flow volumes in the face of the recent onslaught of LNG. A recent OIES podcast on Russian gas sets out why the Russian political landscape may continue to push Gazprom towards high export volumes.
In the short-term, Gazprom could be viewed as foregoing short-term revenue by contributing to a TTF slump towards $4/mmbtu. There are historic precedents for Gazprom reducing exports in response to lower prices (e.g. across the 2009-10 price slump).
But it is possible that Russia is pursuing a longer term more strategic objective in continuing to push gas into a well supplied European market. By allowing TTF (& by arbitrage Asian LNG spot prices) to fall well below the break-even price required for new LNG projects (7-8 $/mmbtu), Russia may be targeting the delay of new liquefaction project FIDs across 2019-20.
In a recent article we detailed the substantial volumes of new LNG supply queued for FID. The 2019 slump in global spot prices does not make FID decisions easy, even if it currently looks like there could be a supply gap in the early to mid-2020s.
FID delays or cancellations would serve to bolster Russia’s market share of the European gas market over the next five years. It would also support faster price recovery in the early to mid – 2020s.
The inability of Asian demand to absorb supply growth across Winter 2018-19 has pushed the European gas market into a new phase of intense market share competition between LNG and Russian pipeline gas. The trajectory of Asian LNG demand growth is set to be the key arbiter of just how fierce that competition will become, especially across 2019 & 2020.