Today we check the state of play in the ‘tug of war’ between Europe and Asia for LNG. We take a quick 4 chart tour to check the barometer on market volume & pricing dynamics.
“The decline in summer prices reflects an easing in the risk premium associated with Russian supply cuts”
LNG imports have been balancing a very tight European gas market in 2022. Chart 1 shows European LNG imports surging this year (left hand panel). In order to attract incremental LNG cargoes, European buyers are driving up prices to attract supply from Asia (right hand panel).
Chart 1: Europe vs Asia LNG import volumes
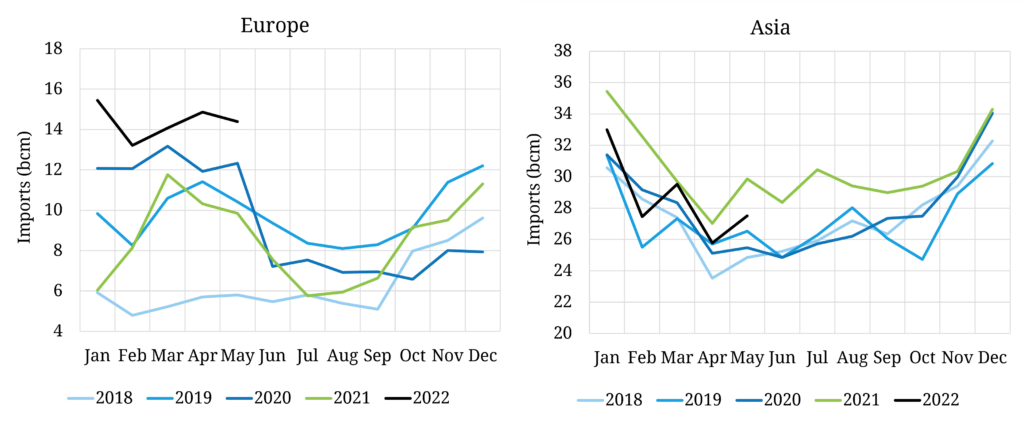
Source: Timera Energy, LNG Unlimited
It is this battle between European and Asian buyers that is driving LNG market pricing dynamics.
Demand response driving prices
Demand response economics are currently the dominant marginal price setting mechanism in the LNG market. European power markets are effectively fully switched to coal (given extreme gas prices). So price response in the LNG market is focused on Asia in the form of:
- Fuel switching from gas to coal fired generation (e.g. in China) or gas to oil substitution
- Outright demand destruction given high prices (e.g. Indian industry).
In order for Europe to attract incremental LNG supply, European gas hub prices are trading at a premium to Asia as shown in the left hand panel of Chart 2.
Chart 2: Europe vs Asian LNG price differentials
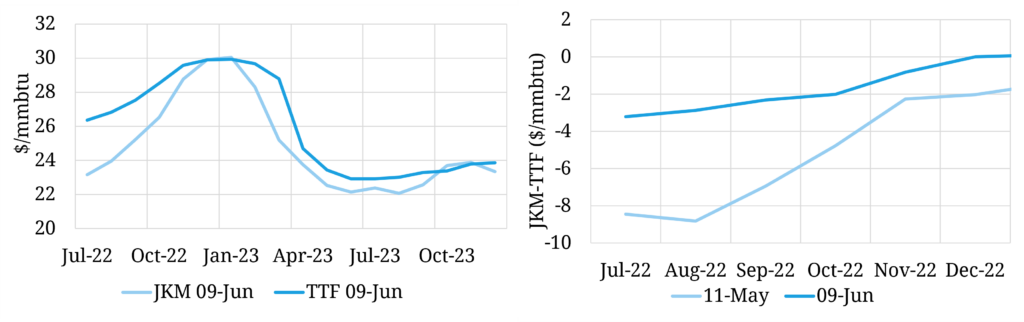
Source: Timera Energy, CME
However the forward market premium of TTF over JKM has eased significantly across the last month as can be seen in the right hand panel which shows the discount of JKM to TTF prices. This in part reflects an easing in risks around further Russian supply cuts (ruble payments issue) and the ongoing improvement in European storage inventories.
JKM forward prices have been converging with TTF across the coming winter (although TTF remains at a premium). But TTF vs JKM price spreads are set to remain volatile as relatively unresponsive sources of demand continue to drive marginal pricing to clear the Atlantic & Pacific basins in what remain poor liquidity conditions given margining & collateral issues.
Regas constraints drive TTF discounts
The key price spread from a LNG cargo flow perspective is not the JKM vs TTF spread but JKM vs NW Europe DES spot price spread.
Chart 3 shows the steep discount of NW European spot vs TTF spot prices that has opened up in 2022. This discount reflects NW European regas terminal constraints. Cargo owners who do not have regas access are being forced to sell on the water at a heavy discount in order to monetise gas.
Chart 3: NW European DES price discount to TTF
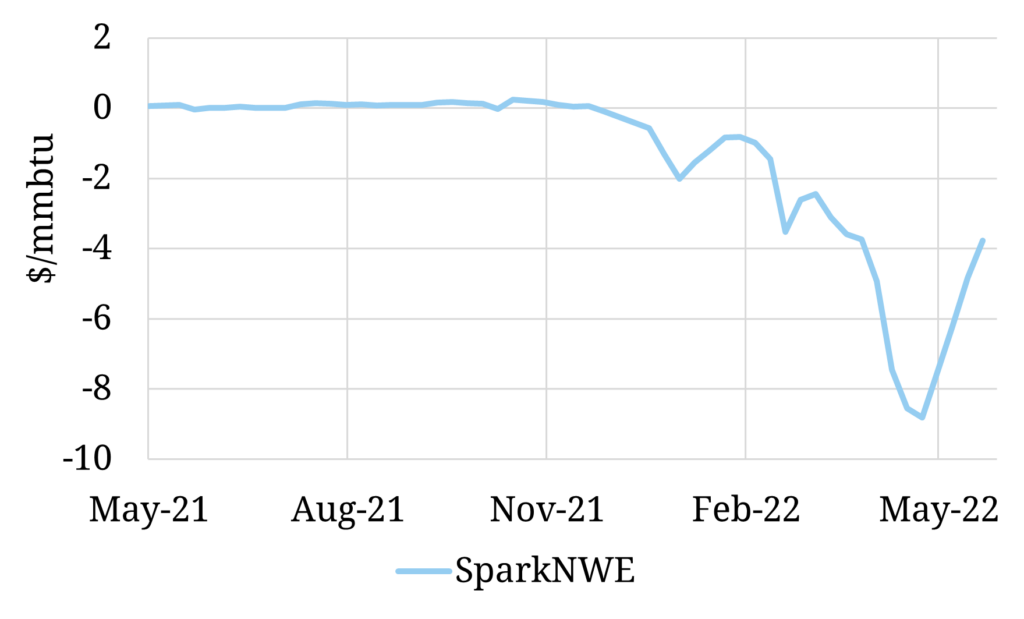
Source: Timera Energy, Spark Commodities
The chart shows this discount also easing across the last month as LNG imports into NW Europe have declined. The discount on a forward basis next winter is a narrower 1-2 $/mmbtu.
NBP discount to TTF is easing
We set out recently the record divergence that has opened up between Europe’s two key hubs TTF & NBP. As with the charts above, the NBP discount to TTF has also eased across the last month as shown in Chart 4.
Chart 4: NBP vs TTF forward curves in early May vs early Jun
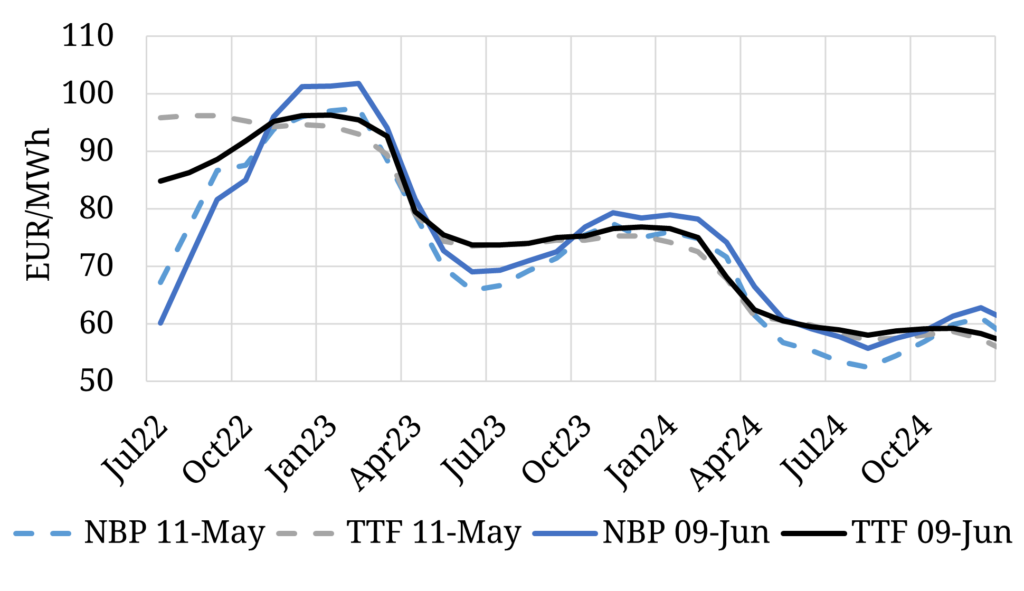
Source: Timera Energy, ICE
The other important dynamic shown in the chart is the front of the TTF curve swinging from backwardation to contango across the last month. This decline in summer prices reflects erosion of the risk premium relating to near term Russian supply cuts. It is also providing a clear market incentive for storage injections into the coming winter.
The European gas crisis is a long way from over. But there are some signs across the last month of a least a temporary easing in market stress.
We are looking to recruit both Analysts and Senior Analysts into our LNG team. For more details please email us at recruitment@timera-energy.com.