Not all LNG is created equal. The carbon footprint of an LNG cargo varies significantly depending on production source, processing & transportation. Cargo differentiation by carbon footprint is becoming an important value driver.
“LNG is a means to displace coal fired power & industry in Asia…
…but tackling its emissions footprint will be key to securing LNGs role in a decarbonising world.”
2021 has seen rapid growth in ‘low carbon LNG’ deals signed. This is being driven by end users, increasingly concerned from both a policy and a shareholder perspective about accountability for the carbon footprint of their supply chains. LNG producers & suppliers are also focusing on emissions transparency and reduction as a differentiator in marketing their product.
In today’s article we break down the LNG carbon footprint components, look at recent low carbon contract structures and consider a case study around shipping emissions optimisation & value. We also look at 5 commercial implications of the push for lower carbon LNG.
What is the emissions footprint of an LNG cargo?
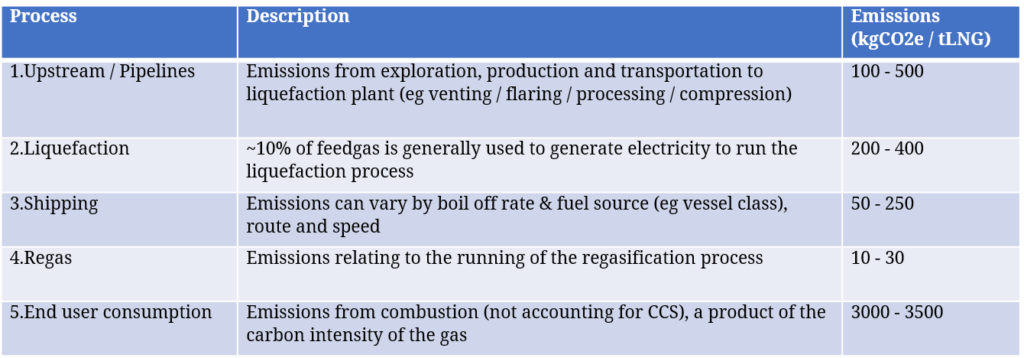
End use consumption of an LNG cargo dominates its carbon footprint. This depends on the carbon intensity of feedgas, but 190 kt of CO2 equivalent per standard cargo is a reasonable benchmark.
In addition to this core footprint there are several other key sources of carbon emissions summarised in Table 1 below, which includes indicative ranges for kg of CO2e emitted per tonne of LNG consumed.
From well head to burner tip, these add another 20 to 70 kt of CO2 footprint to a standard cargo (on top of end-user consumption). The emergence of ‘low carbon’ or ‘green’ LNG contracts is focused on measuring, reducing & in some cases offsetting the emissions footprint in categories 1. to 4. in the table.
Low carbon contract evolution
Let’s consider some practical commercial steps being taken by market players to address LNG emissions.
Measuring & reporting
One of the main challenges in tackling the carbon footprint of LNG is a lack of standardisation in the way emissions are measured and data is sourced, verified and reported. Both producers and suppliers are starting to tackle this issue via embedding emissions reporting within contracts and commercial processes. For example:
- Pavilion SPA deal with Qatar Petroleum where each LNG cargo will be accompanied by statement of associated GHG emissions
- Cheniere to provide cargo emissions data from wellhead to cargo delivery point from 2022.
There is strong momentum building behind a broader implementation of measurement & reporting standards across LNG supply chains.
Emissions reduction
Producers & suppliers have control over some components of the LNG emissions footprint. An important consideration here is the source of feedgas, which impacts upstream, pipeline & liquefaction emissions.
This means lower carbon footprint upstream projects are set to have an advantage in marketing their gas going forward. For example Shell’s LNG Canada project claims to have less than half the industry average LNG footprint, compared to some US projects where methane is vented or flared.
As a result, producers are actively taking steps to reduce the carbon footprint of new LNG production projects e.g. the CCS & boil off gas recovery system integrated within the Qatari expansion.
The other important emissions component that suppliers can manage is shipping. This covers vessel efficiency, fuel choice (e.g. fuel oil vs boil-off gas and length of journey). We consider the impact of these in a specific case study below.
Carbon emissions offsetting
Offsets are also being used as a way to reduce the carbon footprint of delivered LNG. Total delivered the first ‘carbon-neutral’ LNG cargo to CNOOC in Sep 2020. The carbon emissions footprint of the cargo was offset via Verified Carbon Standard (VCS) certificates, which are backed off e.g. by forestation, renewables & emissions reduction projects.
Carbon-neutral LNG contracts are rapidly gaining traction. This is being driven by end-user demand such as Tokyo Gas and 14 end users recently forming the Japanese ‘carbon neutral buyers LNG alliance’. Producers & suppliers are also actively marketing carbon neutral LNG e.g. Shell’s recently announced deals with large Asian buyers CNOOC and CPC. And traders like Vitol are using offsets to offer ‘green LNG’ products to customers.
Case study: quantifying & managing shipping emissions
Shipping related emissions dominate the carbon footprint associated with the midstream of the LNG supply chain. To illustrate shipping dynamics, we look at a case study of emissions produced across the transportation leg for a 3.5tbtu cargo.
We use our LNG Bridge portfolio model to calculate & optimise the cargo emissions footprint. We have been working with a range of our LNG Bridge clients to develop functionality in the model to calculate & report emissions (e.g. loaded CO2 content & emissions from boil off/fuel oil) to support the pricing & optimisation of low carbon LNG contracts.
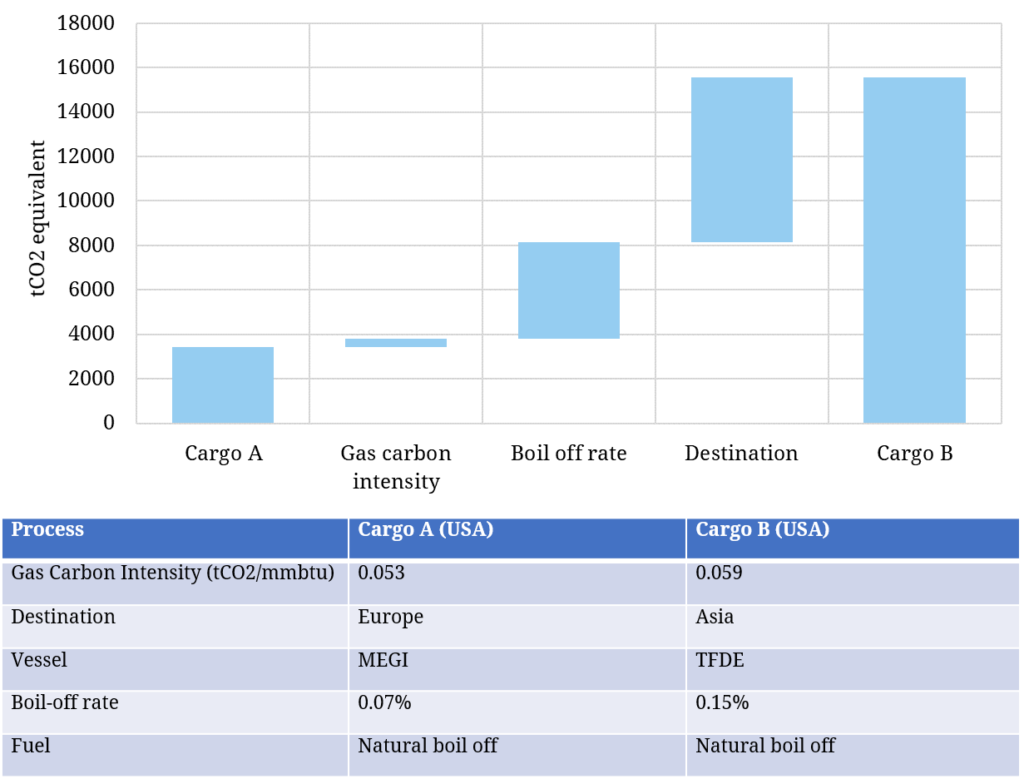
The case study considers two US cargoes shipped via different vessel types to Europe and Asia as summarised in Chart 1 below.
Cargo A (US to Europe) is shipped on an efficient MEGI vessel, with a low boil off rate of 0.07%/d. Cargo B (US to Asia) is shipped on an older TFDE vessel, with a comparatively high boil off rate of 0.15%/d. Both vessels are assumed to be fuelled by natural boil off alone (i.e. no fuel oil emissions assumed).
The shipping related carbon emissions footprint for Cargo B is 12 kt higher than for Cargo A. The challenge from an emissions management perspective is there is no clear market price signal to incentivise emissions reduction (given shipping is not covered by existing carbon trading schemes). But to give a sense of potential future impact, at 50 €/t this variation in shipping emissions is equivalent to €600k or ~0.2$/mmbtu.
5 commercial considerations
We finish with 5 factors to consider on the commercial implications of the growth in low carbon LNG:
- Greenwashing: Sceptics will say low carbon LNG is a PR exercise and with some justification. Clear economic incentives will be needed to drive industry wide changes in behaviour supported by sensible regulatory & industry standards.
- Demand: Growth in low carbon LNG demand is real, but its pace will depend on the willingness of end users to pay for a premium product. That will initially be driven by domestic policy of large consumers (eg EU, Japan, Korea, China) and shareholder mandates to reduce emissions footprints.
- Carbon Pricing: Premium pricing for low carbon LNG, drives an implicit ‘shadow price’ for carbon emissions within the LNG supply chain. This shadow carbon price is set to increase & become more transparent as a result of standardisation (e.g. a green LNG spec) and increasing deal volume.
- Supply: Pricing of carbon may alter the FID ‘merit order’ of new LNG supply projects based on emissions footprint. It also has implications for the variable cost of flexible supply & trade flows e.g. for US export volumes.
- Management: Low carbon contracts add additional complexity to LNG portfolio value and optimisation. This requires the ability to track & optimise emissions across the supply chain, as well as the ability to price deals based on the dynamics of the underlying portfolio.
LNG is a means to displace coal fired power & industry in developing economies… but tackling its emissions footprint will be important to secure LNGs role in a decarbonising world.
With Easter next Mon, our next feature article will be published on Apr 12th.
Click here if you want more details on the LNG Bridge portfolio model.