Europe is leading a global push to decarbonise power markets with renewable energy sources. Decarbonisation looks to be a tough but achievable challenge, with wind & solar capacity set to do the heavy lifting.
“Current policy support across Europe is grossly inadequate to support the required volumes of flex from low carbon sources.”
More than 350GW of new wind and solar is projected to come online across Western Europe over the next 10 years. At the same time, large volumes of dispatchable nuclear, coal & lignite capacity are due to close, at least 40GW by 2023 and 80GW by 2030.
We set out the challenges of such a rapidly changing European capacity mix in a recent article. This highlighted what in our view is a substantial shortfall in flexible capacity investment in order to support growing wind & solar output volumes.
In today’s article we use two case studies to illustrate the flexibility required to support renewable output swings in 2020 compared to 2030. We also consider the assertion that these swings can be supported by electricity storage alone (e.g. batteries).
Renewable output vs reliability
The most common benchmarks for renewable output are average annual load factors. Load factors vary significantly by site and geography but rough indicative ranges are:
- 35-45% for offshore wind
- 20-30% for onshore wind
- 10-15% for solar
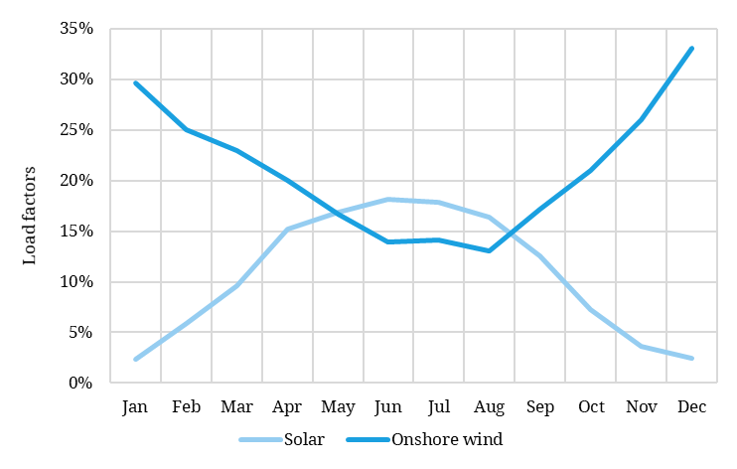
However average load factors hide both strong seasonality and large intraday volatility. On a seasonal level, wind and solar are complimentary. This is illustrated in Chart 1 which shows observed load factors for solar and onshore wind in Germany)
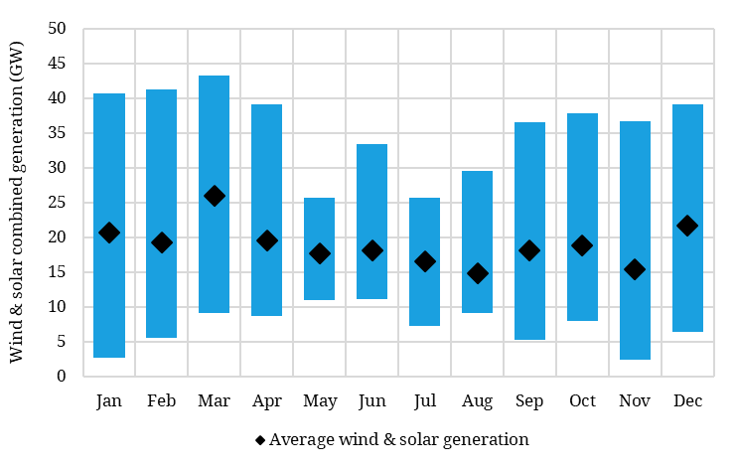
While there is some uncertainty in seasonal patterns of wind & solar output, the much larger system challenges come from intraday swings in output due to changing wind and cloud cover dynamics. Chart 2 shows monthly minimum and maximum German wind and solar output plotted against average monthly output for 2019.
Take an illustrative example of a high demand month like January. Average wind & solar output across the month was the equivalent of 21GW of continuous capacity contribution. But there was a day in Jan 2019 when output fell to the equivalent of 3GW (and it was lower in individual hours across that period) and another day when output topped 40GW.
You cannot run a reliable electricity system based on the 21GW average wind & solar contribution. System flexibility is required to cope with the 3GW and 40GW days as well.
To better understand the implications of rising intermittency, we consider two practical case studies covering a high and low renewable output day.
Case study 1: Low renewables day
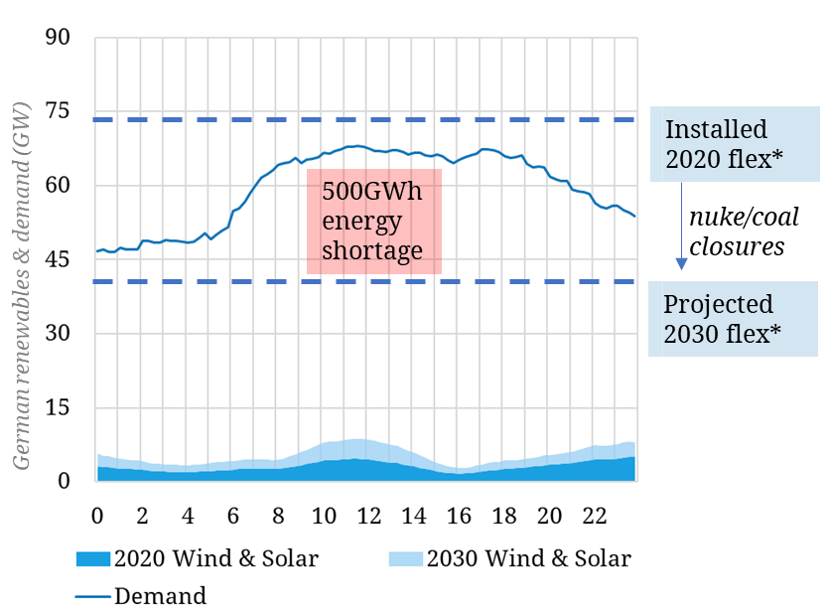
Our two case studies are based on actual recently observed load, wind & solar data in Germany (the 2020 case). We then scale up wind & solar output based on the projected capacity growth required to meet the latest German 2030 renewable policy targets. Chart 3 plots our low renewables case study day.
Chart 3: Low renewables day in Germany 2020 v 2030
Source: ENTSOE, Timera Energy
The dark blue shaded area at the bottom of the chart shows 2020 wind and solar output across a given 24 hour period. The blue line shows power demand. The top blue dashed line on the chart shows the level of installed dispatchable (‘flex’) capacity in 2020 (just under 75GW). In other words there is a comfortable volume of dispatchable capacity to cover low wind & solar output days in 2020.
Now let’s consider 2030. The lighter blue shaded area at the bottom of the chart shows the incremental increase in wind & solar output in 2030. Despite the large increase in nominal renewable capacity, there is only a relatively small increase in output on a low wind & solar day.
In contrast there is a more than 30GW reduction in dispatchable flexible capacity by 2030. Nuclear, coal & lignite closures drag the blue dashed line down to a level that leaves an approximately 500GWh energy shortage across the day. This is the equivalent of 250GW of 2 hour average duration storage.
In practice, only a portion of this energy gap can be plugged by storage. Interconnectors will also play a role, although a relatively high correlation of wind patterns across NW Europe means Germany’s neighbouring markets may be in a similar position. But there is a substantial requirement for investment in new flexible capacity e.g. in the form of batteries, gas peakers and demand response.
Day 2: High renewables day
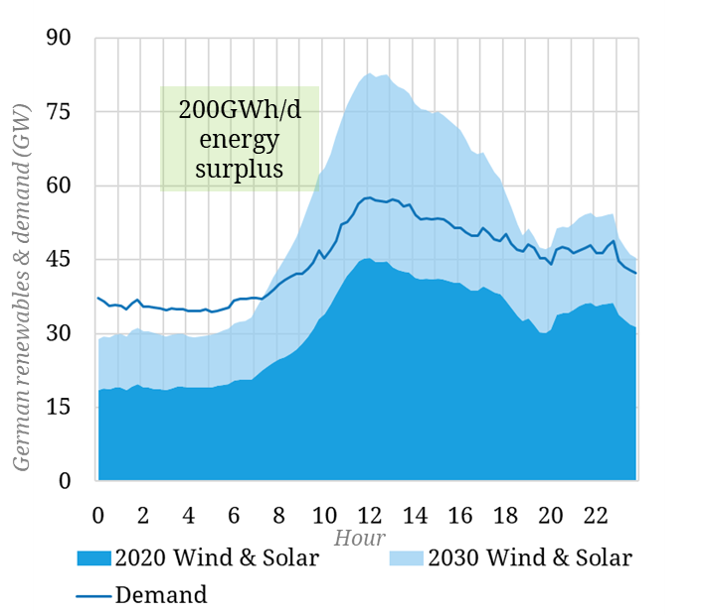
Our second case study considers a high wind & solar output day as shown in Chart 4
Chart 4: High renewables day in Germany 2020 v 2030
Source: ENTSOE, Timera Energy
Wind & solar output in 2020 (the dark blue shaded area) falls short of demand (blue line). But on a high wind & solar day in 2030, the additional renewable output rises well above system demand.
This creates a large energy surplus (200 GWh/d) that either needs to be curtailed or pushed into neighbouring markets via interconnectors. This could rise to over 1.5TWh of energy surplus across a more sustained windy period across a number of days.
The volumes of surplus energy are too large to store in the absence of a major new source of flexible demand (e.g. large scale hydrogen electrolysis). Exporting big volumes via interconnectors is also a challenge if there are corellated wind & solar patterns in neighbouring markets.
Flexible investment implications
We do not mean to downplay the role of electricity storage, particularly batteries. Storage is set to play a key role in absorbing excess energy, peak shaving and providing very high speed balancing. But storage is a net consumer (not a producer) of energy and current technology (e.g. 1-2 hour duration batteries) have limited practical application for shifting large volumes of energy.
There is also large potential for broader engagement of the demand side. But the flex characteristics of demand side response are typically similar to storage i.e. shorter duration and at best net energy neutral.
Interconnectors can help shift energy from lower to higher valued locations. But the rapid deployment of renewables across Europe will increasingly see neighbouring countries with correlated tight or oversupplied market balances.
Current policy support across Europe is grossly inadequate to support the required volumes of flex from low carbon sources. Even heroic assumptions on storage, demand response and interconnector deployment do not close the flexibility deficit in markets like Germany.
That leaves conventional gas-fired generation playing a structural flexibility provision role well through the 2030s, albeit at steadily declining load factors. And that is not an outcome that is inconsistent with net zero emissions targets in 2050. Gas generation is effectively buying time for the commercialisation and scale up of low carbon flex capacity such as hydrogen and longer duration storage.
Briefing pack: The flexibility to decarbonise
Click on link to download our briefing pack with detailed analysis on flex capacity investment requirement, building an investment case and asset opportunities. |
