The UK power market entered this winter with the tightest system reserve margin since market liberalisation in the 1990s. The reserve margin has fallen sharply over the last five years as older gas and coal plants have retired. The closure of three large coal plants in the first half of 2016 set up particularly tight conditions for the current winter.
Symptoms of market tightness over the last three winters have been disguised by relatively mild & windy weather. High volumes of lower cost imports from the Continent have also helped to dampen volatility. But Q4 2016 saw UK power prices and generation margins explode higher as system stress set in.
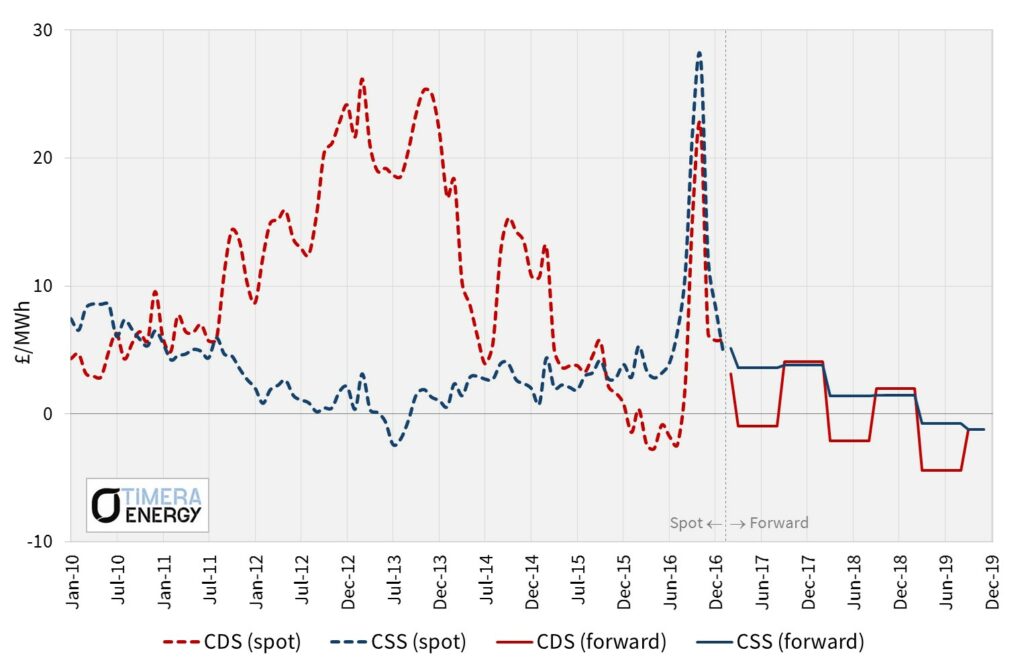
After spending most of the last five years in a relatively tight 0 to 5 £/MWh range, gas plant generation margins spiked towards 30 £/MWh in Q4 2016. Chart 1 shows the scale of the Q4 jump in Clean Spark Spreads (CSS) relative to the rest of this decade.
The French nuclear outages we looked at last week were a big factor behind the UK’s Q4 price spike, as the two markets fought for available electricity across the interconnector. But more normal conditions have returned in Q1 2017 as French nukes have come back online.
Generation margins in the forward market for Winter 2017-18 have also returned to more subdued levels, as shown in Chart 1. This relates in part to the calming influence of the extra auction (EA) for capacity in 2017-18 that cleared on February 3rd. In today’s article we look at the results of this EA auction and consider how UK price dynamics next winter may compare to the conditions experienced this winter.
As we have pointed out a number of times before, forward curves are not forecasts of spot price evolution. The downward slope of forward CSS prices is primarly driven by contango in the gas curve. There is also very limited liquidity beyond the front three seasons in the UK power market, meaning published forward prices have little relevance beyond 2018. To better understand how spot price evolution may diverge from forward pricing, it is important to dig into supply, demand and marginal price setting dynamics in the UK power market.
EA auction
The extra 2017-18 capacity auction was implemented by the UK government in 2016 in response to widespread criticism of the Supplemental Balancing Response (SBR) mechanism, used to procure emergency reserve capacity over the last three winters. The EA auction allowed the government to directly influence the system capacity level from Oct 2017, helping to alleviate concerns around security of supply.
The lower EA auction clearing price (6.95 £/kW) was primarily a function of a surplus of 3.6GW of existing capacity over the government’s demand target. 57.2 GW of existing capacity prequalified for the auction (including the already commissioned Carrington CCGT which is categorised as new capacity) versus the 53.6 GW target.
You could be forgiven for thinking it sounds strange that a market as tight as the UK can have such a surplus of existing capacity. Chart 2 sheds some light on how this is possible, at least in a capacity accounting sense.
Chart 2: Summary of EA auction volumes
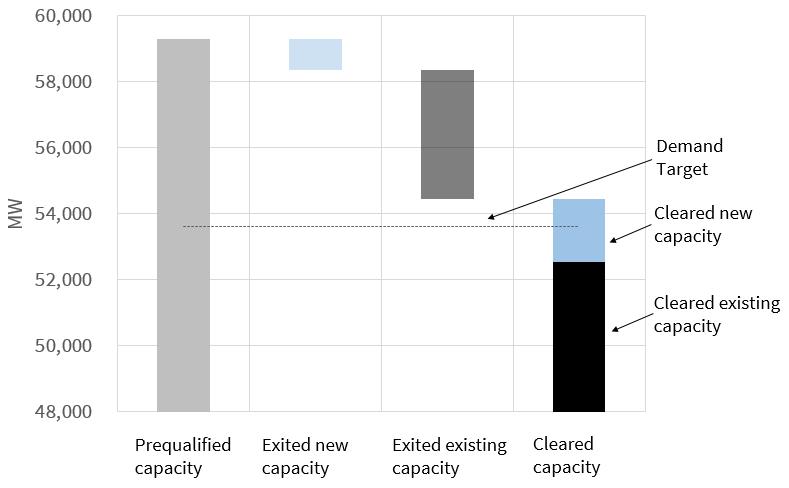
Source: Timera Energy, Grid provisional auction results
The key numbers from the auction results that are shown in Chart 2 are as follows:
- Cleared capacity: Of the 59.3 GW of prequalified capacity, 54.4 GW of capacity cleared the auction (above the government’s 53.6 GW demand target, given a downward sloping demand curve and lower clearing price).
- Cleared new capacity: 1 GW of new capacity was successful (0.9 GW of new generation, 0.2 GW of new DSR), effectively adding to the surplus of existing capacity. This capacity predominantly came from the accelerated delivery of small scale peaker projects successful in previous T-4 auctions. Note the 0.8GW Carrington CCGT is also technically classified as new capacity, but we have excluded this given it is already operational.
- Exited existing capacity: 9 GW of existing capacity did not clear the auction. The key thermal units that failed to clear were Barking (already mothballed), Deeside CCGT, 1 unit of Fiddlers Ferry coal station, Peterhead CCGT, 2 units of Ratcliffe coal station and the remaining units of Uskmouth coal station.
The two main surprises from the auction were:
- The Eggborough coal plant (1.8GW derated) cleared the auction, helping to push down the auction price.
- Ratcliffe Units 1 & 3 (448 MW each) exited the auction despite these units having T-4 agreements for 2018-21.
It is reasonable to assume that up to 2.4GW of existing capacity that was unsuccessful in the auction will close or be unavailable to provide capacity next winter. This excludes the two Ratcliffe units, given the status of these next winter is not yet clear.
Market dynamics in Winter 2016 vs Winter 2017
The tight UK capacity balance this winter has clearly resulted in higher power prices and generation margins (as shown in Chart 1). So let’s consider how this capacity balance is likely to change by next winter:
The following is an estimated breakdown of the main incremental changes that may occur:
- SBR: 3.5 GW (derated) of ‘emergency response’ SBR capacity comes back into normal supply stack as the SBR mechanism is discontinued.
Withdrawals: An estimated 2.4 GW (derated) capacity closes during 2017 or is unavailable to provide capacity next winter (after exiting the EA auction). This could be less if some of these units remain online despite not receiving capacity payments.
- New build: 1.1 GW (derated) of new, predominantly peaking, capacity is built by Oct 17.
- Renewables: ~1.5 GW (nameplate) of new renewables capacity comes online, predominantly intermittent wind.
In a capacity accounting sense those changes result in a system reserve margin that National Grid estimates is consistent with the UK government’s security of supply standard (3 hour LOLE). But underneath the headline capacity level, there are some important changes in supply stack dynamics.
In isolation, the return of 3.5GW of SBR capacity back into the supply stack should definitely have a price and volatility dampening effect. This is because this capacity will return to operating on a short run marginal cost basis. The effective variable cost of dispatching SBR capacity across Winter 2016-17 has been very high given the ‘emergency response’ guidelines.
The ‘SBR return’ benefit may be significantly offset by the removal of up to 2.4GW of capacity from the supply stack. Replacement capacity comes mainly in the form of new peakers and wind capacity. But the peakers have high effective variable dispatch costs (e.g. 150-250 £/MWh) compared to the larger coal and CCGT units that are closing. And new wind capacity is intermittent versus the flexible capacity it is replacing.
There is also a thorny question as to whether the government’s assumed capacity contribution from interconnectors is still appropriate after issues with flows from France over the current winter (see our article last week).
So in summary, the system reserve buffer may have improved versus last winter in a capacity accounting sense. But the UK market will be more dependent on intermittent renewable capacity and higher variable cost peakers by next winter. These factors are likely to continue to support CCGT generation margins and power price volatility until new CCGT capacity is built next decade.
Article written by David Stokes & Olly Spinks