Europe’s pivot away from Russian gas is driving an investment surge in new LNG supply. Europe needs to replace around 150 bcma (110 mtpa) of Russian supply. That’s a lot of gas, and most of it is set to come from incremental LNG imports.
“US supply contracts are transforming LNG portfolios… but they come with risks.”
The US will be a key source of LNG supply growth. Investment in new US liquefaction capacity is underpinned by flexible long term supply contracts. These are typically structured as tolling deals with a fixed capacity fee, hub indexed gas cost and volume & destination flexibility.
Gas indexation & flexibility drive buyer enthusiasm for US LNG contracts. But these benefits come with a material risk exposures. When signing up to US LNG it is important to understand how contract value is driven by price, volume dynamics and destination flexibility under changing market conditions, as well as the different commercial approaches for managing this value.
In today’s article we use practical case studies to explore these value drivers:
- We back-test performance of a US tolling contract across the wild swings in spot market conditions across the last 4 years (2019-22)
- We then test how 3 common US tolling contract management strategies have performed across this horizon.
This provides a fascinating insight into one of the key sources of flexibility driving global gas market dynamics & LNG portfolio value.
US contract netbacks show wild ride
Commodity markets are famous for bouts of extreme volatility driven by supply & demand imbalances and long investment lead times. The rollercoaster ride witnessed in global gas markets across the last 4 years is vying for pole position as one of the greatest periods of commodity market volatility of all time.
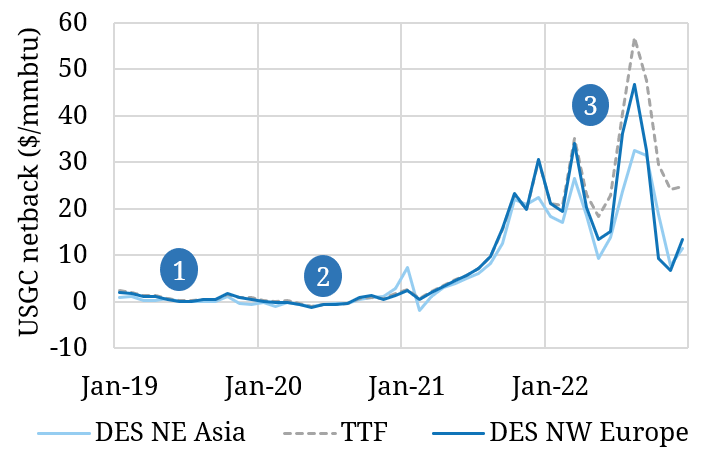
This is illustrated in Chart 1 which shows the netback returns for a Gulf Coast US LNG contract (115% Henry Hub index cost) into European & Asian spot markets (DES NW Europe & DES NE Asia) across 2019 – 2022.
Chart 1: Netback value for US LNG contract vs European & Asian spot prices
Source: Timera Energy, ICE, CME, Spark Commodities
The chart illustrates the impact of 3 different market periods on US tolling contract value:
- Oversupplied market: Weaker Asian LNG demand sees price signals favour Europe. US netbacks were seasonal, typically narrower in summer than winter, averaging 0.9 $/mmbtu in 2019.
- Acutely oversupplied market: The Covid driven demand slump and full European storage inventories require the ‘shut in’ of US LNG exports to balance the market. US netbacks are pushed negative to incentivise cargo cancellations.
- Very tight market: A sharp decline in Russian exports to Europe rapidly tightens European & Asian markets. This drives JKM & TTF prices and US LNG netbacks to surge. European regas capacity constraints cause DES NW Europe LNG prices to fall significantly below TTF prices.
The key takeaway from this simple netback analysis in Chart 1 is that US tolling contracts are exposed to very high earnings variability against spot prices as market conditions change (e.g. from annual average of 0.2 $/mmbtu in 2020 to 23.2 $/mmbtu in 2022).
The challenge of managing US contract value
Across the last 18 months we have been working with several large LNG portfolio players on how to quantify and manage US tolling contract value against the backdrop of rapidly changing market conditions. There are two common themes that are currently in focus:
- How to effectively manage the value of existing US tolling contract exposures within a portfolio
- How to quantify the value & risk from signing up new US contract volumes into a portfolio.
The risk profile of a US tolling contract is a key consideration for both these challenges. The three most common contract management strategies are summarised in Table 1.
Table 1: three strategies for managing US tolling contract exposures
Source: Timera Energy
To bring these three management strategies to life we back-test their performance across the market swings of 2019-22. We do this using our LNG Bridge model, a portfolio optimisation & valuation modelling solution we use with a broad range of large LNG portfolios.
LNG Bridge allows us to analyse the 3 cases against historic rolling prices where at each timestep we can optimise the contract against (i) prevailing spot prices and (ii) market forward prices at that date.
Case A: Impact of hedging
Hedging is a risk management strategy that uses the trading of forward derivatives (e.g. futures & swaps) to offset physical contract exposures. In the case of a US toll, hedging involves buying Henry Hub contracts to hedge the cost leg and selling TTF or JKM contracts to hedge the delivery leg. The aim of hedging is to reduce the variability of contract (& portfolio) returns and limit downside value loss.
In Chart 2 we show the impact of hedging a US tolling contract vs just optimising against spot prices. For all analysis we assume a single vessel time charter at 85 k$/d (augmented with spot shipping where required).
Chart 2: Impact of hedging on US tolling contract margin
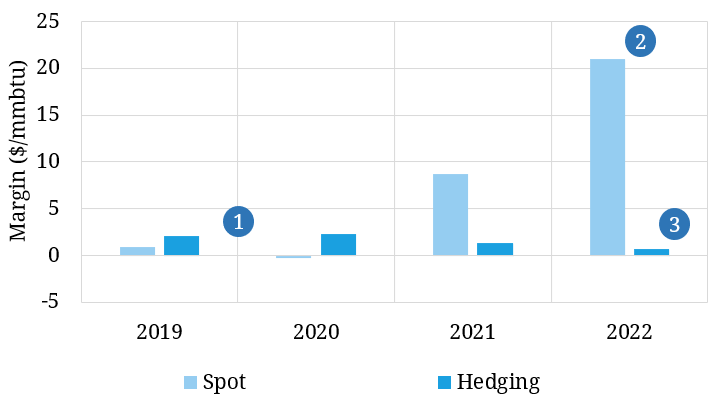
Source: Timera Energy LNG Bridge model. Note: assumes 12 month rolling hedge horizon i.e. in Jan 2020 contract holder hedges out to Jan 2021.
The three dots on the chart align to the following takeaways:
- Risk reduction: Hedging is a commercial decision that materially reduces the spread of potential value outcomes. This acts to positive effect in 2019-20 where margins were pressured by spot price exposure (even going negative in 2020). Across these two years, hedging locked in on average 1.9 $/mmbtu higher margins.
- Caps upside: On the flip side, hedging also acts to reduce upside tail value potential. This meant sacrificing significant value during the extreme price spikes of 2021-22 as contract price spread levels were locked in before netbacks surged closer to delivery. Upside is not completely limited however – there remains optimisation potential from diverting delivery of the cargo between Asia & Europe.
- Basis risk: As European deliveries are hedged on TTF, US tolling contracts still incur significant basis risk on the spread between the TTF gas hub and the NW European DES LNG price. This spread blew out in 2022 illustrating the fact that financial hedging often does not fully offset physical exposures. There are potential ways of mitigating this basis risk e.g. via (i) a NW European derivative (ii) a European regas position (see below) (iii) a proxy LNG-gas hedge on JKM-TTF.
Case B: impact of European market access
A European regas position provides an option to sell an LNG cargo directly into the liquid European gas market (vs selling cargoes against the much less liquid NW European LNG spot market). European regas capacity development and contracting has been a strong industry focus as European imports have surged.
Chart 3 shows the value profile of the US tolling contract combined with regas access (vs the baseline spot price exposure case).
Chart 3: Impact of regas capacity on US tolling contract margin
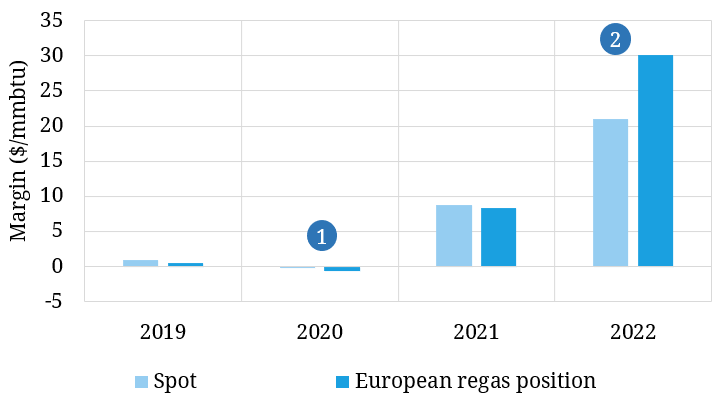
Source: Timera Energy LNG Bridge model
The two dots on the chart align to the following takeaways:
- Regas cost: On a standalone basis the regas business case was challenging across 2019-21 (modelled 0.5 $/mmbtu fixed costs are not recouped), as the DES NW Europe spot market offered a more attractive delivered price. Further upside potential is possible but dependent on downstream flexibility and integration of regas capacity into a wider LNG portfolio.
- Constraint value capture: The huge increase in European imports in 2022 caused significant regas capacity constraints. This forced the DES NW Europe price to a significant discount to TTF (see Chart 1), driving up the value of regas capacity.
While acquiring regas may mean incurring significant costs, it mitigates the challenge of (i) finding liquidity to sell into the LNG spot market (ii) exposure to the DES LNG vs gas hub price differential. These are important considerations from a risk management perspective and can significantly enhance the effectiveness of hedging a US toll.
It is also important to note that regas capacity optionality can unlock portfolio value beyond that accruing to a single US tolling contract. The impact of wider portfolio construction and European spot liquidity are key value drivers of regas.
Case C: impact of contracting to offset exposures
US tolling contract exposure can also be managed via a sales contract with offsetting physical exposures, as contrasted with the financial hedging exposure management approach in Case 1.
The benefits of this include (i) less ongoing derivative liquidity dependence (ii) a more closely matched US toll exposure offset (iii) longer dated exposure management (outside of derivative liquidity horizon) and (iv) reduced requirement for sophisticated trading capability.
In Chart 4 we model the case of an Asian sale contract indexed to Henry Hub, offsetting the physical LNG and Henry Hub price exposure on the US toll.
Chart 4: Impact of Henry Hub indexed Asian sales contract on US tolling contract margin
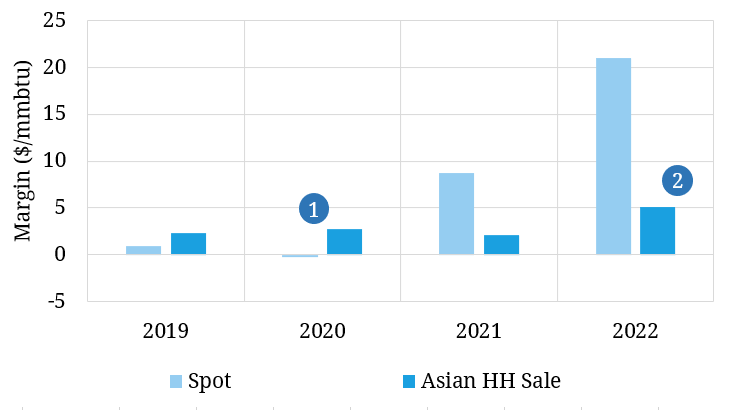
Source: Timera Energy LNG Bridge model
The two dots on the chart align to the following takeaways:
- Risk reduction: Physical exposure offsetting significantly reduces contract margin variability, while also providing downside protection. This combination typically translates into investment ‘bankability’ from an LNG portfolio perspective.
- Some upside retained: Some optimisation potential is retained through diversion flexibility. Where Europe provides the most attractive destination for the US cargo, the Asian contract can be fulfilled from the local spot market. This is reflected in 2022, where margins are 3 $/mmbtu higher than in 2021 (although significantly below the spot exposure base case).
There are a range of other sales contract price indexation options, e.g. Brent indexation that have different value / risk profiles which can also be analysed.
Looking forwards as well as behind
US LNG tolling contracts are becoming an increasingly important driver of (i) LNG market pricing & flow dynamics and (ii) individual portfolio optimisation. This is set to continue as a new wave of US LNG supply comes to market in response to surging European demand.
We use an historical horizon above to analyse the value & risk dynamics of US tolling contracts. This is useful because it is objective and based on realised market price data. But looking backwards is only part of the story.
Our key focus with clients is using LNG Bridge to do simulation based modelling of US tolling value & risk across a forward horizon. It is this analysis which supports decisions on:
- how to manage US toll exposure within a portfolio
- how investment in new US supply contracts can unlock portfolio value and help manage risk.
We will be back soon in a second article with analysis of a US tolling contract over a forward horizon, including conclusions on value & risk.
See here if you are interested in more details on our LNG Bridge model. To discuss our LNG consulting services you can contact Olly Spinks (MD) or David Duncan (Director LNG & gas).