‘I don’t want to bet on the direction of commodity prices’… the statement of a prudent energy asset investor.
“There is a growing narrative that fossil fuel prices may never recover as the energy transition accelerates…
…be wary subscribing to that view over the next 5-10 years.”
Yet major commodity price trends & cycles are a key driver of energy asset value. There are few energy assets that do not have a significant direct or indirect exposure to structural shifts in market prices… whether their owners like it or not.
Take the correlated decline in European gas & power prices over the last two years as an example. It is tough to argue that this price fall has not been a key factor impacting the value of most European energy portfolios. Renewable power assets and investment projects have been hit by declining power prices, just as gas & LNG portfolios have been buffeted by record low hub prices.
The inconvenient truth is that commodity market cycles matter a great deal. It may be imprudent to bet on specific price outcomes. But it is just as imprudent to ignore the key relationship between commodity price cycles and asset value. Commodity cycle turning points can represent both substantial risks & opportunities.
In today’s article we look at the key historical relationship between the US dollar and commodity price cycles for a signal of what could be the start of a major inflection point in commodity prices. We also look at the recovery in gas & power prices since Q1 2020 and the factors that could support a new multi-year uptrend in energy prices.
Why the US dollar matters
Chart 1 provides a strong visual representation of the negative correlation between global commodity prices and the USD over the last 20 years. The white line shows a trade weighted index of the USD against other currencies. The yellow line shows the benchmark CRB global commodity price index.
Chart 1: Trade weighted USD index vs CRB commodity index
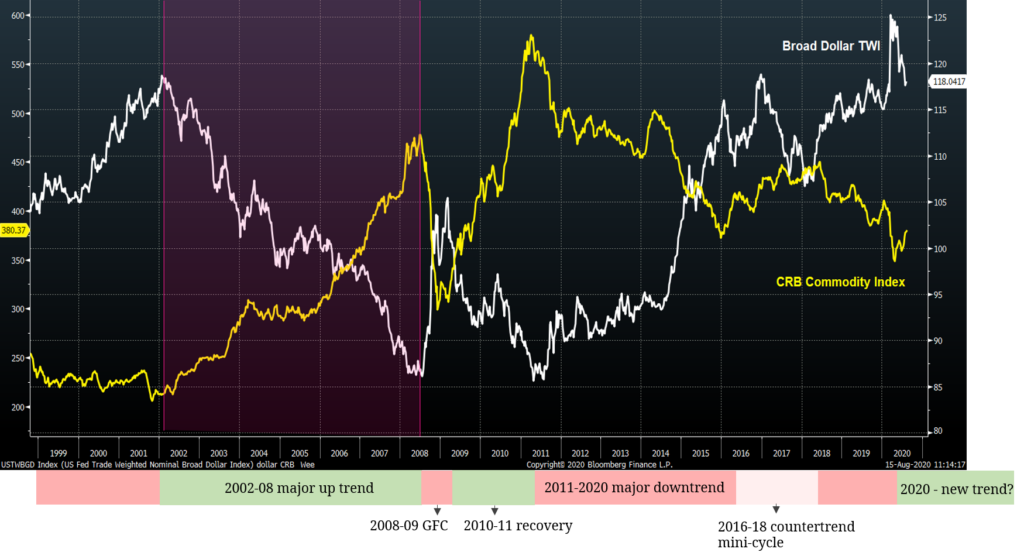
Source: Bloomberg, Timera Energy
The shaded ranges in the boxes below the chart highlight periods of commodity price uptrends (green) and commodity price downtrends (red).
The last 20 years have been dominated by two large trends in the USD:
- A major downtrend from 2002-2008 which coincided with strong growth in developing economies (particularly China) and a major uptrend in commodity prices (the CRB index rose more than 230%)
- A major uptrend from 2011-20 where the USD has strengthened against a deflationary backdrop since the financial crisis, with commodity prices in a structural downtrend.
These major trends have been punctuated by some shocks (e.g. the financial crisis and recovery from 2008-11) and countertrend mini cycles (e.g. the 2016-18 rise in commodity prices as the USD declined).
What drives the negative correlation between the USD and commodity prices?
A simple reason that partly explains this relationship is that global commodities are traded in USD. A decline in the USD denominator increases the value of commodities in dollar terms. But moves in currencies are typically small relative to commodity prices (i.e. currency volatility is low compared to commodity volatility), so there are more significant factors in play.
A key driver of the negative correlation relates to the reserve currency status of the USD. A falling USD stimulates growth in developing economies. This is because many developing economies have large USD debt & trade related liabilities.
A decline in the USD reduces the burden of these liabilities, stimulating economic growth. For example, many developing countries borrow in USD denominated debt (as lenders don’t want higher risk emerging currency exposure) – a declining USD reduces the burden of both principal & interest repayments on GDP growth.
Developing economies are key marginal buyers of commodities (e.g. China & India), so stronger economic growth typically translates into higher commodity demand and rising prices.
Why the USD may be turning
It is hard to argue with the broad negative correlation between the USD and commodity prices shown in Chart 1. But it is less clear what could cause a major USD trend reversal in 2020, after a decade long uptrend. The global policy response to Covid may be an important driver here.
Chart 2 shows a ‘zoomed in’ view of the most liquidly traded USD index over the last 12 month
Chart 2: USD index over last year
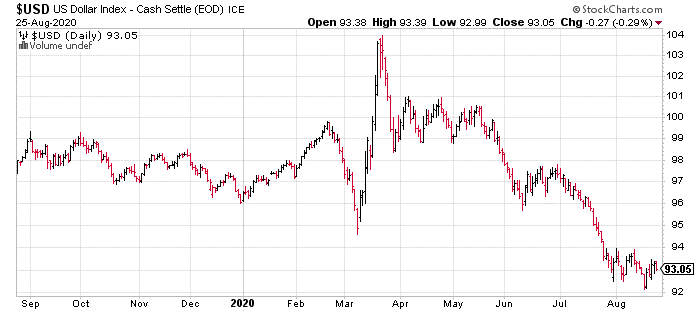
Source: Stockcharts.com
Financial markets woke up to the rapid spread of Covid outside China in Mar 2020. This caused a sharp initial spike in the USD as the shock of Covid shutdowns reverberated through credit markets, causing a global surge in demand for dollars to meet trade & debt related USD liabilities.
But as financial markets plunged, the US launched an unprecedented monetary and fiscal policy response across two weeks, that was orders of magnitude larger than the response to the 2008-09 financial crisis. This included slashing interest rates to zero, opening USD swap lines with other countries, buying huge volumes of government bonds and passing emergency fiscal stimulus packages to the tune of trillions of dollars, as we described here.
Chart 2 shows the USD has fallen about 10% in trade weighted terms since Mar 2020. That may not look like much across the 20 year horizon of Chart 1. But it is a major shift in the world’s reserve currency across a period of less than 6 months.
Could this be a temporary decline or a countertrend move? Possibly. But historically, major changes in USD trends have coincided with global economic shocks and structural changes in monetary & fiscal policy. 2020 has enough of those ingredients to warrant keeping a careful eye on what happens next.
What have gas & power prices been doing since Mar?
Let’s return a bit closer to home and look at what is happening to European gas & power forward prices and how this relates to more recent movements in the USD.
Chart 3 shows the evolution of the Dec 2021 futures contracts for Henry Hub and TTF over the last 12 months. We have chosen this contract to illustrate movements in forward price curves, because it sits beyond the immediate impact of the Covid lockdown horizon.
Chart 3: Major gas forward curve rise since March... in line with USD decline
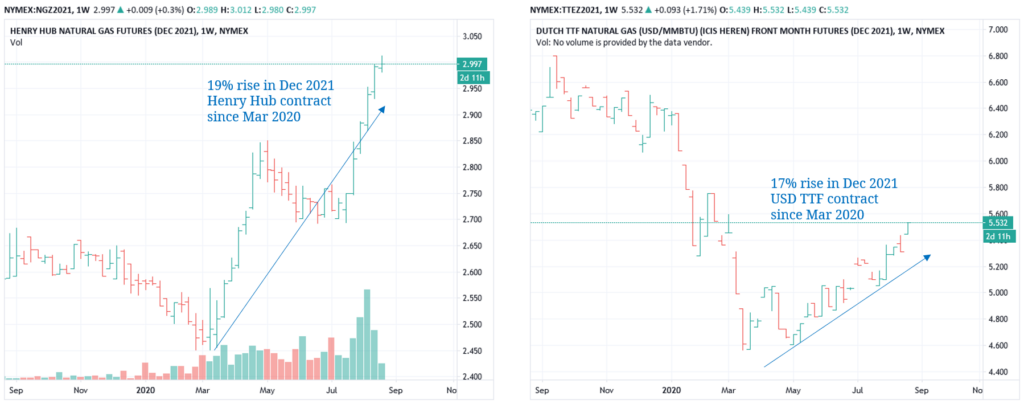
Source: CME, Timera Energy
The left hand panel of Chart 3 shows how the Henry Hub forward curve has moved significantly higher since Mar 2020 (as the USD declined). The US gas forward curve is now well above pre-Covid levels and has continued a strong rally over the summer. An important factor here is declining associated gas production from US shale oil plays.
This recovery in US forward prices is also feeding through into European gas prices, with the TTF forward curve recovering back towards pre-Covid levels. This recovery is being reinforced by evidence of Asian LNG demand recovery which is helping pull JKM prices higher and reducing the surplus volume of LNG cargoes flowing into European hubs.
Power prices have also staged a major recovery since Q1. Market movements across the Covid dynamics of 2020 have demonstrated the key relationship between gas and power prices. With gas-fired plants dominating marginal power price setting across Europe now, swings in gas forward curves are being transmitted directly into power price curves.
The power price recovery has also been supported by an almost doubling in carbon prices since Mar 2020 (from below 15 €/t to around 29 €/t currently). This has reinforced the move higher in European power market forward curves.
5 potential drivers of a new uptrend in gas & power prices
Energy markets have got used to low, in many cases historically low, price levels. There is also a growing narrative that fossil fuel prices may never recover as the energy transition accelerates. That logic may be relevant over a 2050 horizon, but be wary subscribing to it over the next 5-10 years.
Aside from a potential change in USD trend, there are some structural drivers that may be aligning to tighten the supply & demand balance in gas markets, supporting a continuation in the recovery of gas & power prices:
- Fiscal stimulus: the global policy response to Covid can be summarised as large scale ‘borrow & spend’ (vs ‘austerity’ post GFC); that is supportive of demand recovery into 2021-22
- LNG market balance: New global LNG supply falls substantially across 2021-24 (given an investment hiatus from 2016-18); yet Asian LNG demand has been relatively robust through Covid and growth may accelerate as economic recovery picks up
- Producer capex cuts: big producers are slashing investment budgets to preserve balance sheets, curtailing new supply
- Higher cost of capital: Oil & gas investors have been hit hard by Covid related price declines, particularly lenders to US shale; this pain & growing decarbonisation policy risks, will likely drive up the cost of raising capital
- Historically low price levels: Energy prices are both strongly cyclical & mean reverting, supporting the old anecdote that ‘low prices are the best cure for low prices’
We are not suggesting a straight line recovery in gas & power prices from here. Turning points in energy market cycles are typically characterised by uncertainty and high price volatility. But the factors we set out above are flagging the growing probability of a major upside surprise in European gas & power prices over the next 5 years, particularly against the backdrop of a pervasively negative market consensus.