The headline grabbing energy story of the last 6 weeks has been a resurgence of LNG import volumes into Europe. This has been a key driver behind the 50% decline in winter TTF gas prices over the same period, with European power prices falling accordingly.
“Across the last two months LNG charter rates crashed more than 95%”
A mild Asian winter combined with healthy levels of contract cover has seen Asian LNG demand crumble. This has driven winter JKM prices well below TTF signalling the redirection of surplus LNG supply towards Europe.
These conditions have resulted in several days of record LNG sendout in January. They have also driven spot LNG charter rates to crash across the last two months.
Vessel charter rates are the primary component of the marginal cost of moving marginal molecules of LNG between markets. In a world of extreme gas price levels & volatility, marginal molecules drive prices and charter rates are worth keeping a close eye on.
And you thought gas & power prices were volatile…
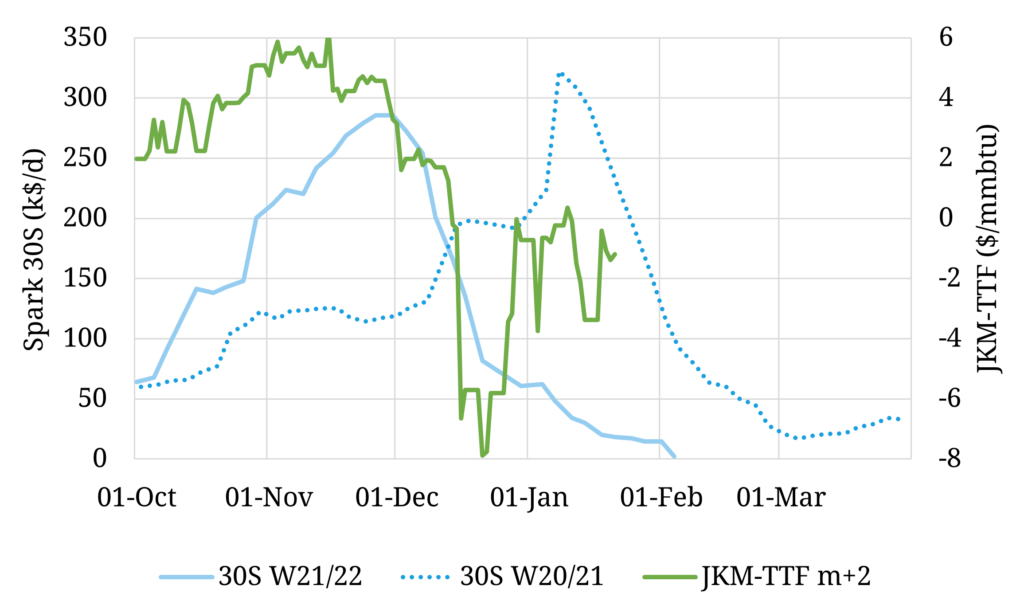
Spot LNG charter rates increased more than 450% across two months from 1st Oct to 1st Dec 2021. Then across the last two months (1st Dec 21 to 1st Feb 22) charter rates crashed more than 95%. Chart 1 tells the story via the light blue line – the Spark Atlantic LNG spot freight assessment.
In a November article we set out the dynamics behind the Q4 charter rate surge. In a nutshell, strong Asian demand into winter saw higher volumes of LNG supply travelling longer distances, resulting in acute tightness in spot vessel capacity.
This was a case study in a circular upwards spiral in both time charter spot rates and JKM-TTF spreads. The events of the last two months are effectively the reversal of these conditions in an aggressive downward spiral of rates and spreads.
At its peak, the Spark Atlantic spot freight assessment (30S) reached close to 300k$/d in late Nov. As the inter-basin JKM – TTF arbitrage spread closed (green line), flexible Atlantic supply faced shorter duration voyages, with lower backhaul requirements. This forced freight rates into a downward spiral to current levels around 2 k$/d.
This sort of charter rate volatility is very unusual, but not unprecedented. Spot rates last winter actually followed a somewhat similar pattern, albeit peaking about 5 weeks later (in early Jan) as a result of an Asian cargo scramble during a severe cold snap. At the time LNG market volatility set new records. These were short lived given what was to follow as 2021 unfolded.
Even putting the extraordinary conditions of the last two winters aside, seasonality generally results in a relaxation of freight rates into the end of winter. This is the consequence of an easing in global supply utilisation as the northern winter subsides, requiring less Atlantic supply to flow into the Pacific.
What is the forward market telling us now?
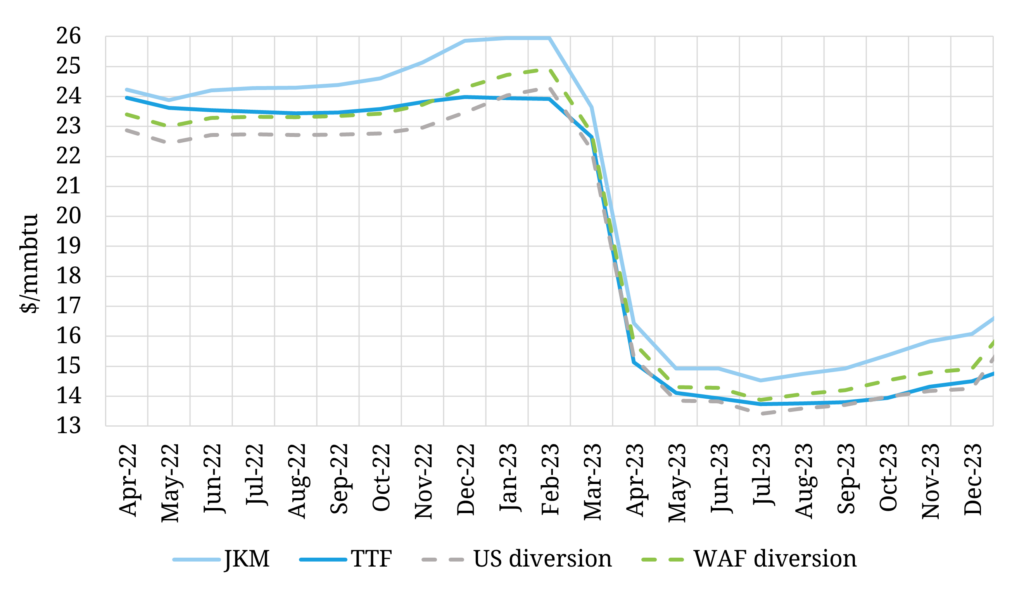
The relative levels of forward curves and cargo diversion prices provide a useful view of how the market is pricing LNG over the next couple of years. Chart 2 shows the forward curves for JKM & DES NW Europe (implied from TTF) – the blue lines.
The chart also shows diversion price levels for West African (WAF) & US supply – the dashed green and grey lines. If these diversion prices sit below the NW European price (driven by TTF) then it is more profitable to send cargoes to Europe, and vice versa. The diversion curves are calculated based on the JKM price less the incremental round trip costs to divert a cargo from Asia to Europe.
The curves in the chart are consistent with strong supply to Europe across the coming summer, especially in Q2. High LNG import levels are a key difference between this year and 2021 as we set out in our ‘TTF shock in animation’ article last week.
From the start of 2023, the forward market is suggesting an easing of the current acute tightness. In this more balanced regime the US would be providing the marginal molecule (i.e. US diversion levels are broadly aligned with TTF).
These dynamics are reflected in European regas bookings, with a high proportion of slots booked through this year. A rising interest in the European market as a destination for LNG also supports the increasing importance of European cargoes being traded in the secondary market.
Asia dominated LNG market action in 2021. Europe is pushing back into the limelight in 2022, with LNG market dynamics set to be a key driver of European gas & power prices this year.