One of the key challenges the European gas market has faced in 2021 has been the limited price response of LNG supply. Strong demand from Asia (led by China) has driven a premium of Asian LNG prices over Europe to incentivise sufficient supply flows to the Pacific.
“Charter rates have more than tripled across the last 2 months”
We set how diversion cost dynamics drive the spread between Asia & European LNG prices earlier this year. Today we look at freight rates as a key variable driving diversion cost dynamics and consider the current market impact of surging charter rates.
Charter rate drivers & why they are surging
LNG vessel charter rates typically follow a similar seasonality to global LNG prices. This is because increased Northern Hemisphere winter demand and higher % supply utilisation acts to increase both (i) tonnes of LNG on water and (ii) tonne-miles (as more Atlantic supply is pulled into the Pacific to meet Asian demand).
Around this basic seasonal pattern, it is fair to say that spot charter rates can be very volatile as illustrated by Chart 1.
Chart 1: Spark front month LNG charter rates for Pacific (25F) & Atlantic (30F)
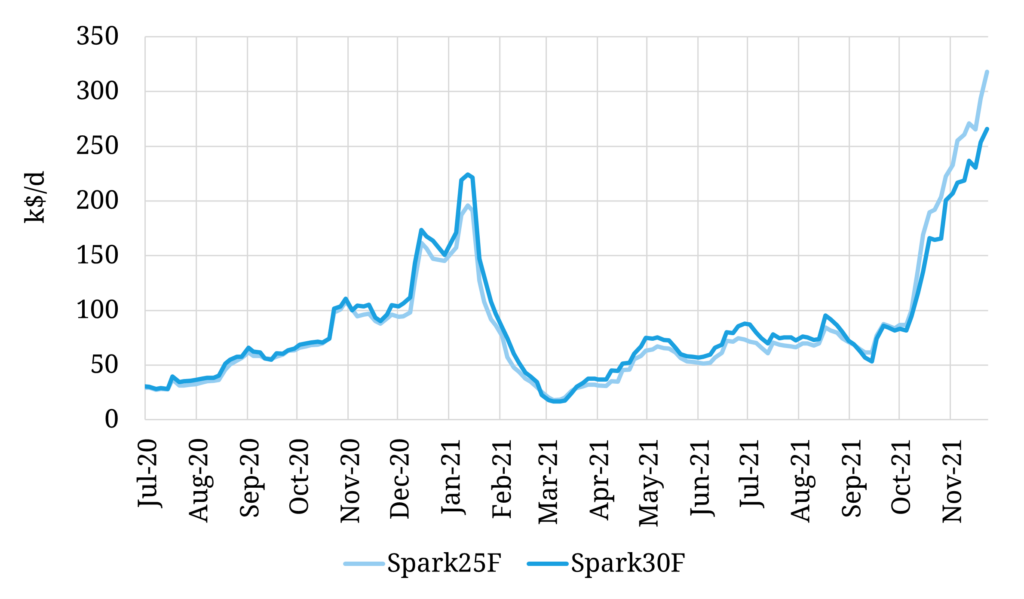
Source: Spark Commodities, Timera Energy
In Summer 2020 charter rates were on their knees. US cargo cancellations reduced demand for vessels against a backdrop of an oversupplied LNG market. Vessel fixtures were even heard of at zero $ per day charter cost, given sunk fixed costs and players trying to avoid variable costs.
Spark data in the chart shows front month Atlantic rates (30F) peaking at $220k/day last winter. However, spot vessel fixtures reportedly took place at up to $330 k/d within the 15-30 day horizon of low liquidity and logistical constraints.
Front month rates have been structurally higher in 2021 versus last year, as a tighter global market & higher netbacks have ensured that US cargoes do not need to be cancelled.
Chart 1 shows the scale of the most recent surge in charter rates that has taken hold since early October. Front month rates have more than tripled in the space of 2 months, breaking above peak fixture levels seen in the Jan 21 extreme cold snap driven scramble for cargos.
The latest surge in charter rates is being driven by:
- Strong Pacific demand for US cargos, increasing shipping distances
- Higher liquefaction plant utilisation into winter, following summer maintenance & outages
- Panama Canal congestion (waiting times quoted as up to 18 days one way), tying up tonnage.
Unless you are an LNG trader, this may seem interesting but a little obscure. However, charter rates have a much broader relevance given their impact on global gas prices.
Higher freight = higher prices
There is an important circular interdependence between charter rate dynamics & underlying LNG market dynamics. This can be summarised as follows:
- A tighter LNG market sees Asian prices increase to draw in LNG supply from further afield…
- … this increases average voyage distance and canal utilisation…
- … which in turn increases charter rates due to higher demand…
- … which in turn causes Asian prices to move even higher, due to higher diversion costs from incremental sources of LNG.
This plays out helping the market to rebalance, with higher prices also triggering demand response, reducing the requirement for physical LNG supplies (e.g., as can be seen recently with lower Indian imports).
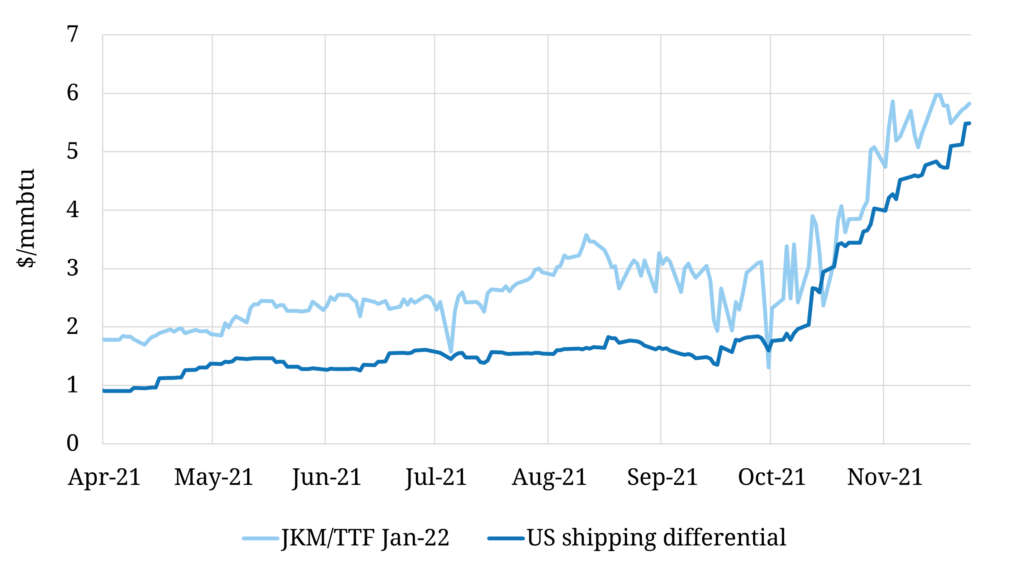
These dynamics are clearly illustrated by recent price movements in the Jan-22 JKM-TTF price spread as shown in Chart 2.
The JKM-TTF spread for Jan-22 delivery has rocketed from 2.3 $/mmbtu at the start of October to 5.7 $/mmbtu, an increase of around 250%. The charts shows a close relationship to the recent surge in the shipping cost differential of delivering a US gulf coast cargo into Asia vs Europe.
There are two factors driving up the cost of moving US cargoes to Asia:
- The increase in charter rates we describe above
- Long delays to transit the Panama Canal.
The latter is the result of LNG market being caught up in broader shipping constraints as canal capacity is inadequate to meet vessel demand. Canal waiting times have ballooned to over 18 days since the start of Oct. At these waiting times, the surge in charter rates is equivalent to an almost 4 $/mmbtu increase in the shipping cost differential for a US cargo delivering to Asia vs Europe (typically the marginal balancing molecule).
While there are additional factors that can be taken into account (e.g., voyage routing via the Cape of Good Hope, floating into Month+1), the US shipping differential helps to a large degree to explain the increase JKM-TTF price spreads.
Importance of robust treatment of charter rates in LNG analysis
The current market situation we set out above illustrates how important charter rates are in driving LNG market prices and price spreads. Yet charter rates are often treated relatively simplistically in LNG market, asset & portfolio analysis (e.g., as a static input assumption).
We see the effective capture of charter rate vs market price dynamics in LNG analysis as a key driver of competitive advantage. Without proper treatment of these interdependencies, money is left on the table when valuing and optimising LNG portfolios.
This is why we take into account the relationship between charter rates & LNG pricing in the pricing logic of illiquid LNG spot markets in our LNG Bridge model. And why we are working on developing fully correlated simulation of charter rates & prices in LNG Bridge’s Monte Carlo price simulation engine.
See here for more details on our LNG Bridge portfolio valuation model .