

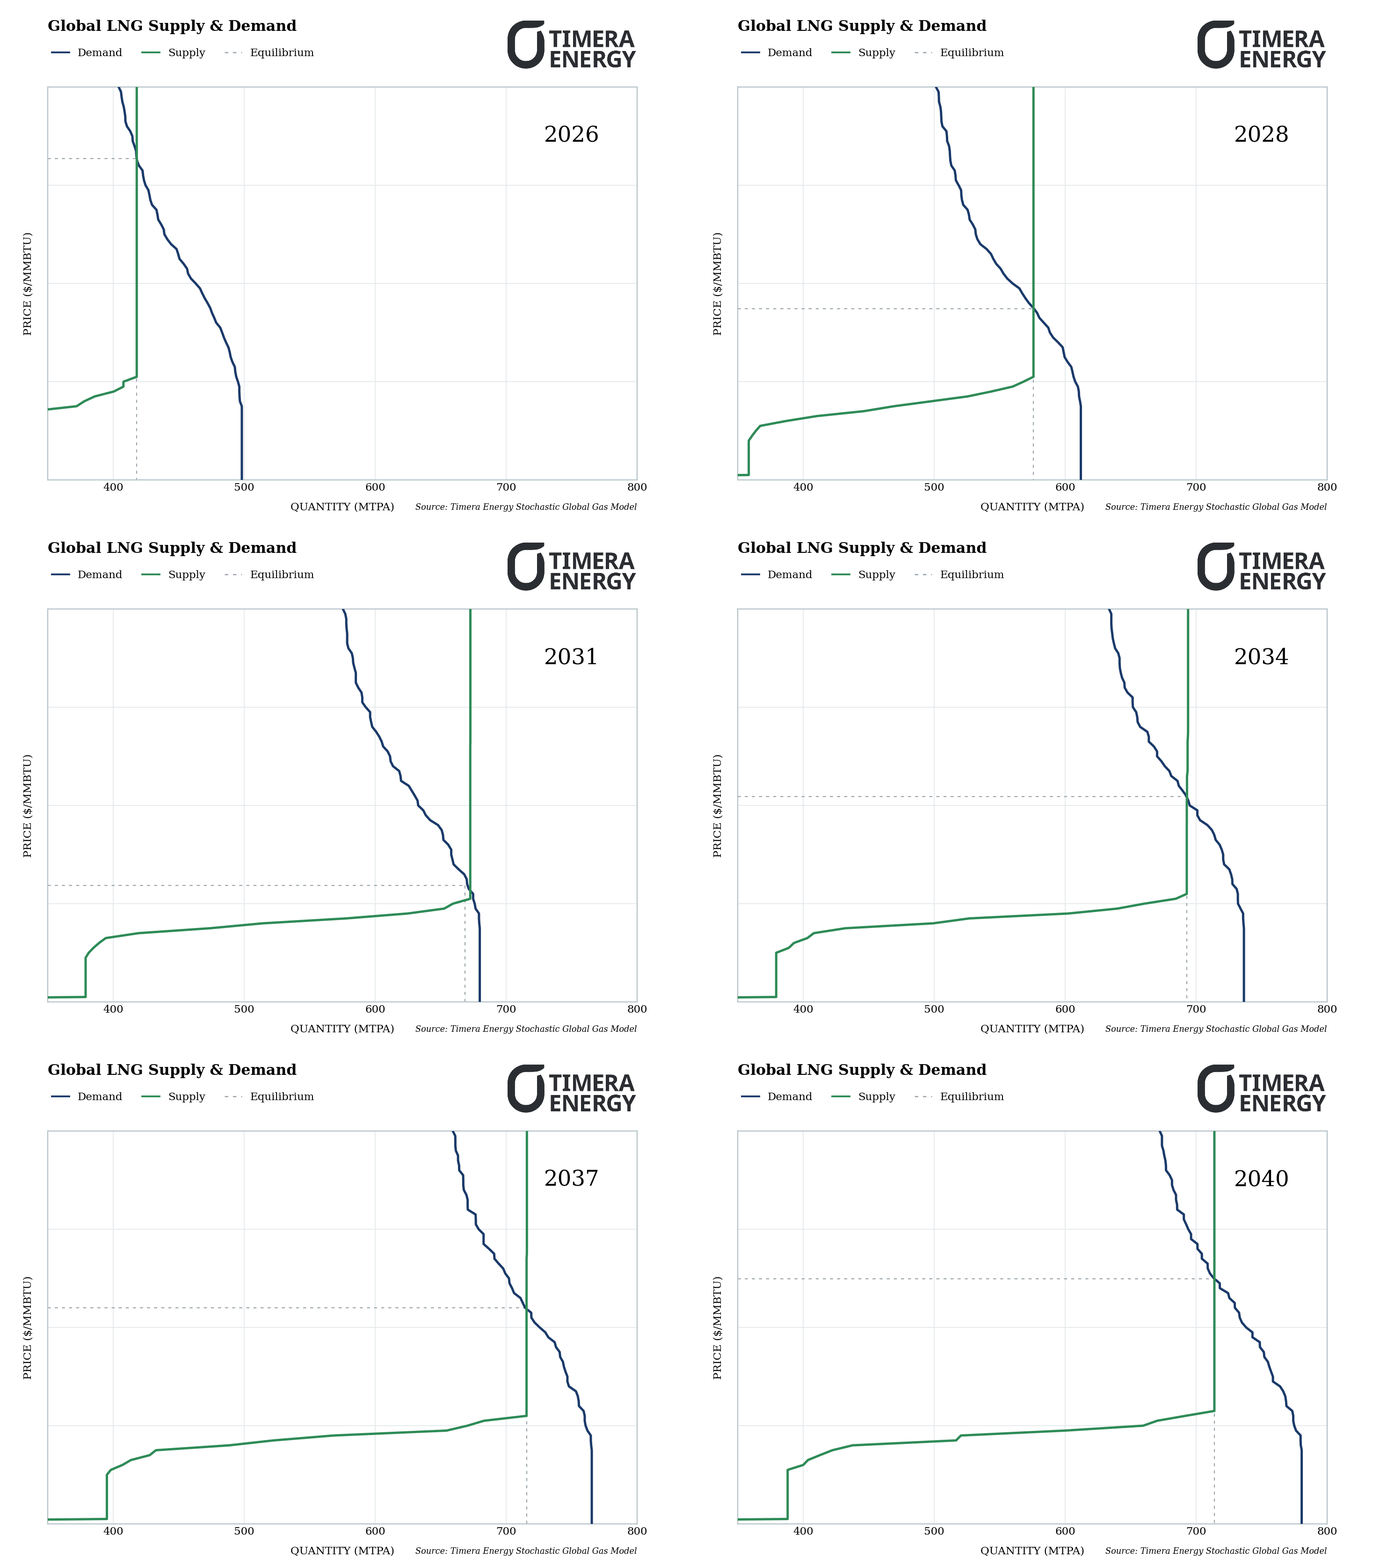
The animation above is of an illustrative scenario drawn from our Stochastic Global Gas Model. It tracks how the global LNG supply and demand curves evolve from 2026 to 2040 as the current wave of FID-confirmed capacity comes online.
* Curves are aggregated to a global, annual level here for narrative simplicity — the underlying model runs at monthly, regional granularity.
What’s driving the shape of the curve in this scenario:
- Growing supply: new capacity from projects that have already taken FID pushes the supply curve steadily right as the animation runs into the 2030s. US Gulf Coast trains (e.g. Rio Grande, Plaquemines) remain the largest contributor, but a friendlier regulatory environment in Canada (extended export-licence terms, “national interest” project status, streamlined federal approvals) has made West Coast Canadian LNG an increasingly important source of new supply.
- Price-sensitive demand response: in the front few years, oil-to-gas switching is the dominant lever, absorbing new supply as it arrives. But as baseload demand grows (shifting the demand curve right), it struggles to keep pace with supply additions, pushing the market clearing price (the intersection on the graph) down and through the switching band by the early-to-mid 2030s. As prices fall further, coal-to-gas switching in the power sector takes over as the key mechanism, providing a soft floor against further downside.
- US supply flexibility provides a floor: shut-ins of US LNG limit how far prices can fall in the early-2030s, with subsequent price recovery dependent upon the pace of new supply build-out, which is set to slow into the late-2030s.
- Structural demand growth underpins recovery: structural demand growth outpaces supply growth through the second half of the 2030s, bringing prices back from the trough. Lower prices in the intervening years catalyse infrastructure buildout that creates durable baseload demand. That recovery, in turn, underpins continued investment across the value chain.
This is a flavour of the analysis in our Q2 Global Gas Report, recently published to our Global Gas Service clients. Reach out to Luke Cottell (Associate Director, Gas & LNG) at luke.cottell@timera-energy.com for a sample extract.