US gas price volatility is set to become a much bigger driver of LNG market value & risk across the next 5 yrs. There are two factors behind this:
- A sharp increase in US LNG export volumes as new liquefaction capacity comes online (110 mtpa rise 2026-30)
- Increasing convergence of global LNG prices (e.g. JKM / TTF) with US prices (e.g. Henry Hub) as new supply eases US export constraints.
Henry Hub price volatility was relatively subdued over most of 2023-25, but started to wake up in late 2025. Prices have seen large swings within a 2.80 – 5.20 $/mmbtu range from Sep 2025 to Jan 2026. Prices surged again from the lower end of this range last week as cold weather hit.
The LNG market impact of this US price volatility is currently muted by the structural separation of JKM & TTF prices from Henry Hub (HH). US export capacity constraints mean that Asian & European prices trade at a significant premium to the US.
However the rapid ramp up in new supply across 2026-30 is set to drive increasing global price convergence and a greater influence of HH on global price dynamics. Chart 1 shows an illustrative scenario for evolution of LNG market pricing across the next 5 years with new supply pushing JKM prices down through Asian coal & oil switching support bands towards the variable cost of US Gulf Coast LNG export supply.
Chart 1: Scenario for evolution of JKM prices vs switching & US variable export costs
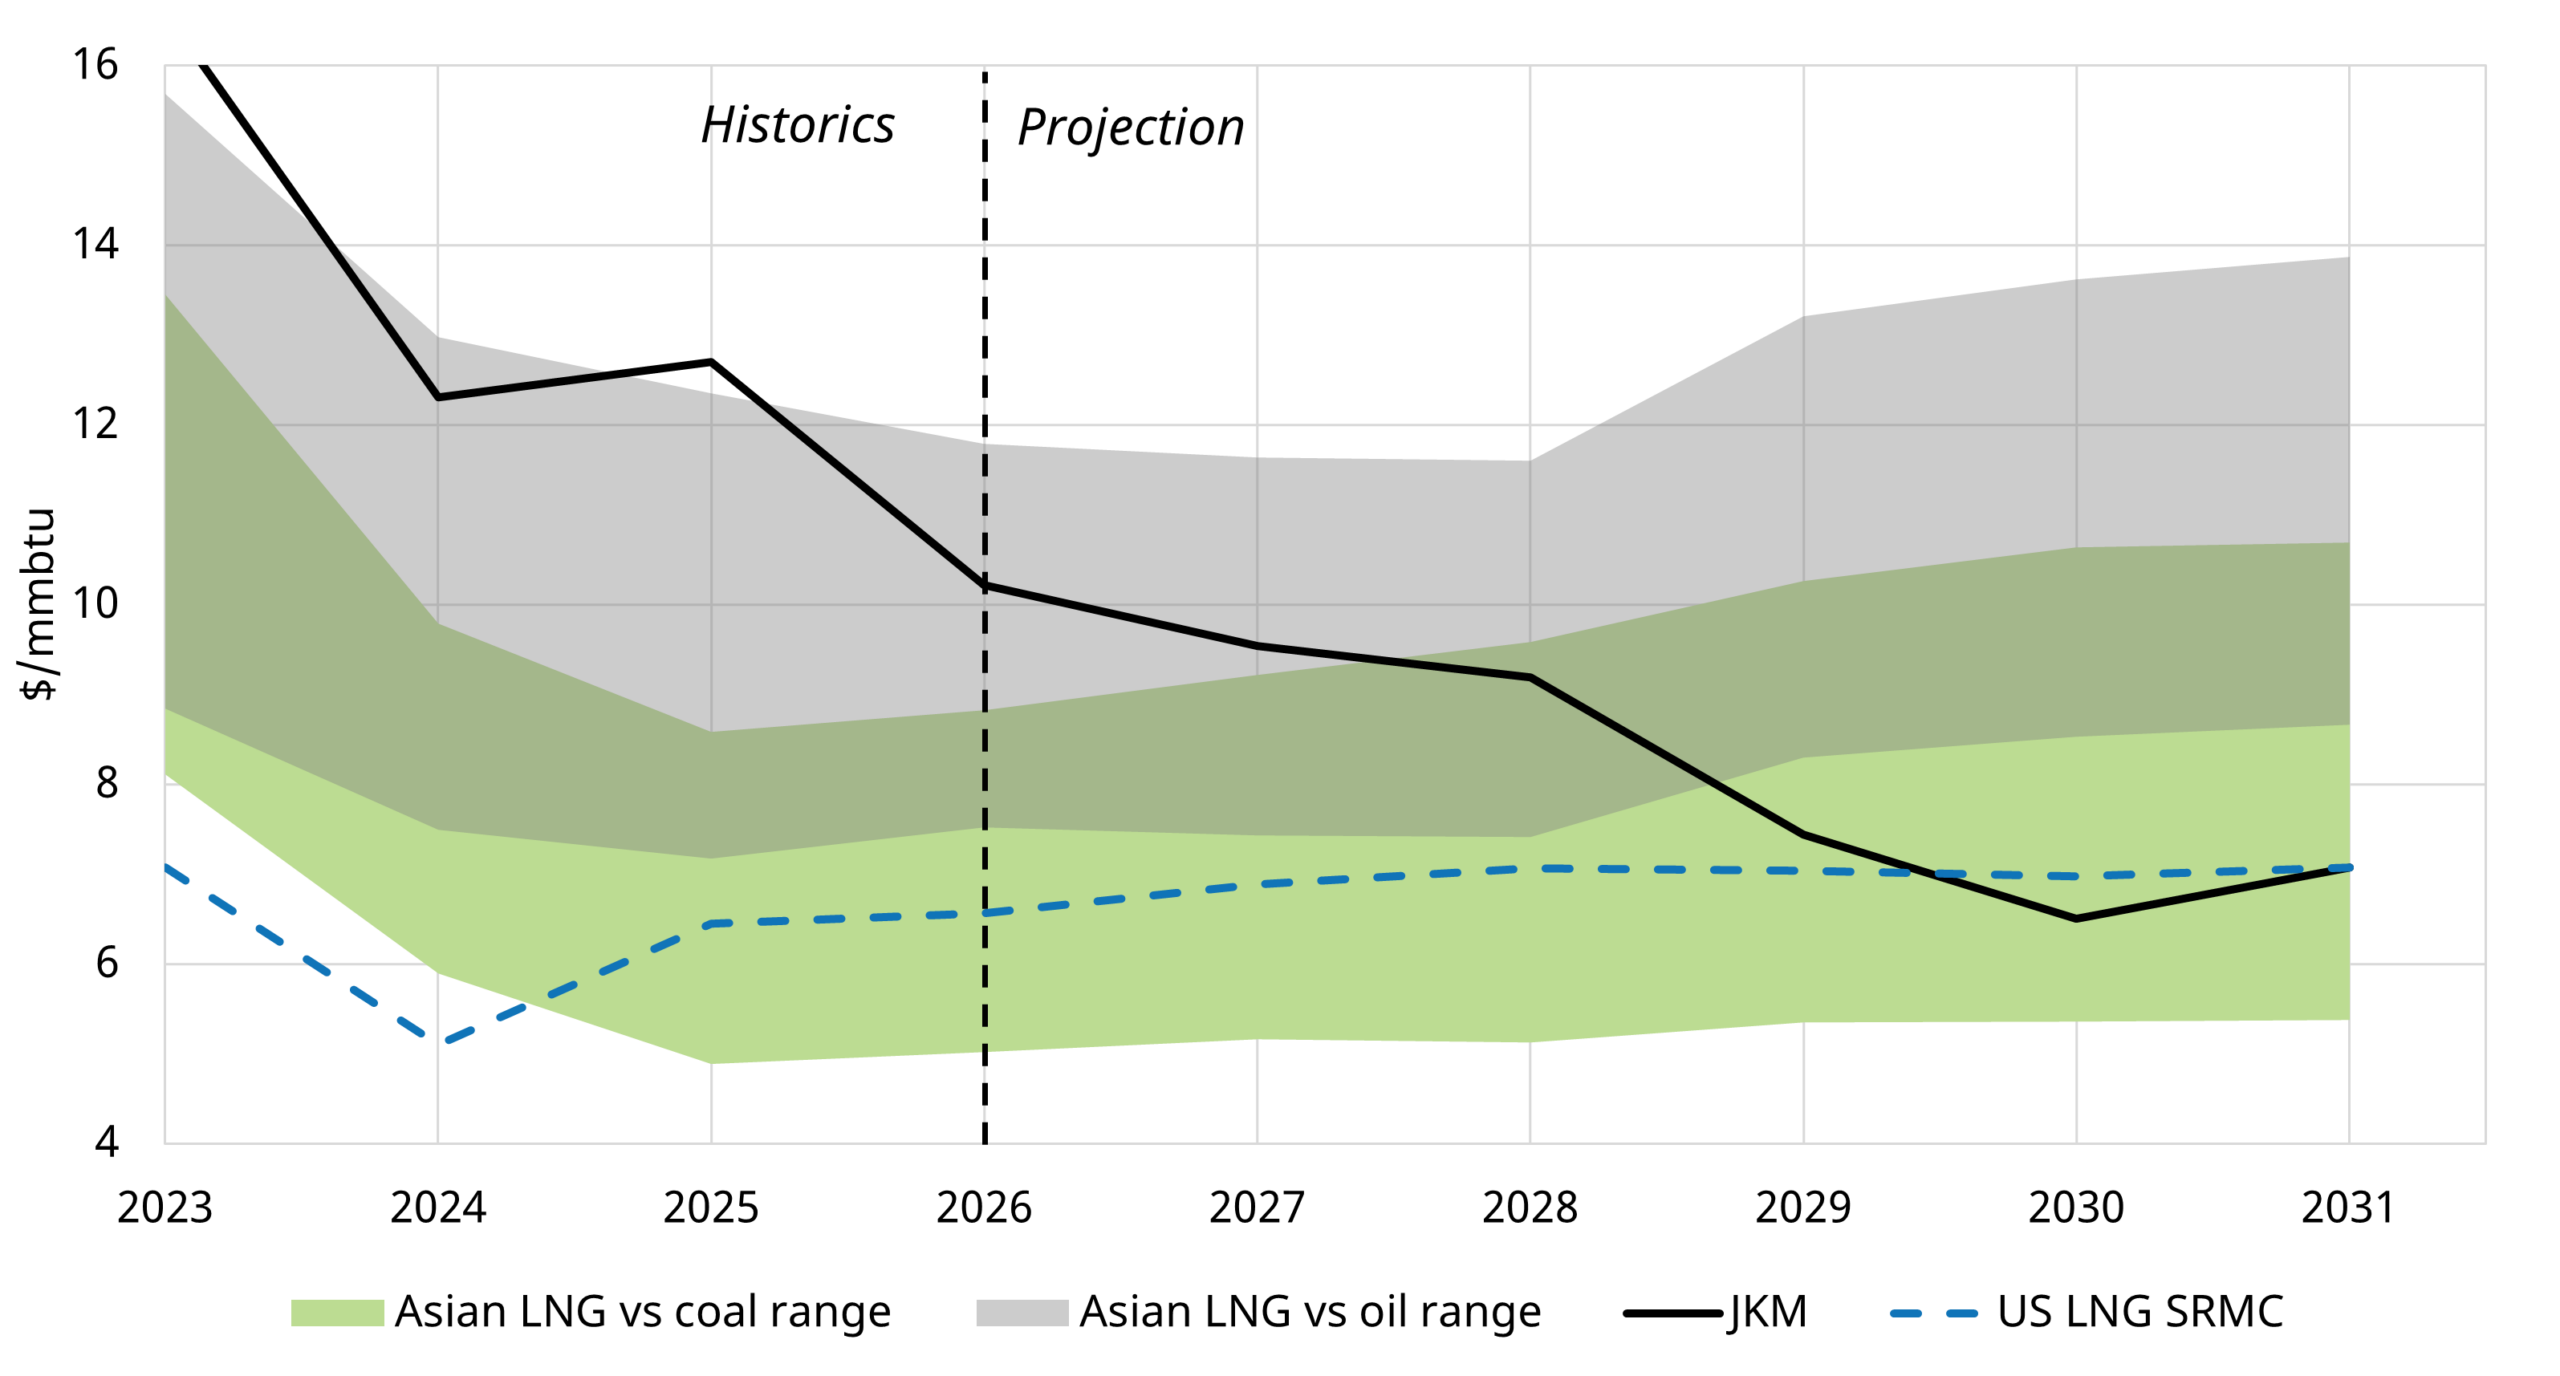
Source: Timera Global Gas Model
In today’s article, we set out analysis showing how HH volatility is set to impact LNG market pricing across the next 5 years, based on the scenario in the chart, as well as some key commercial implications.
Quantifying the impact of price volatility on LNG value & risk
Market price volatility is the largest value driver & risk factor for most LNG portfolios. This is via both:
- Gas price volatility (e.g. JKM, TTF, HH & a range of other LNG markers)
- Broader commodity price volatility (e.g. the indirect impact of oil, coal & carbon prices on gas prices, as well as direct oil indexed exposures in portfolios).
Traditional deterministic (Base / High / Low) scenario analysis is a weak tool for quantifying the impact of commodity price volatility on value & risk. Robust probabilistic analysis is required to produce meaningful distributions of market outcomes & asset values in order to support commercial decision making.
At Timera, we have just released a major upgrade of our stochastic global gas market model. This model produces hundreds of correlated simulations of different commodity prices (e.g. different gas price markers, oil, coal & carbon prices), as well as simulations of global supply & demand volume variability.
The model is a powerful weapon to shed light on the changing impact of HH on LNG portfolios. Let’s take a look at some analysis via a case study where we focus in on the specific impact of Henry Hub price volatility on market prices & asset value. This is only one specific use case of the model.
HH volatility impacts US export contract margins
As US LNG export contract volumes surge, contract margins have an increasingly important impact on portfolio value and risk. The simplest benchmark for margins on US export contracts is the spread between the JKM price and 115% of the HH price (115% reflecting variable liquefaction costs).
Chart 2 shows the evolution of the specific impact of HH price volatility on the JKM – 115% HH price spread distribution (P5 – P95) for our illustrative scenario.
In order to generate this distribution , we are using our stochastic market model to isolate the impact of HH volatility on price spread evolution.
Chart 2: Impact of HH volatility on JKM – 115% HH price spread distribution (P5 – P95)
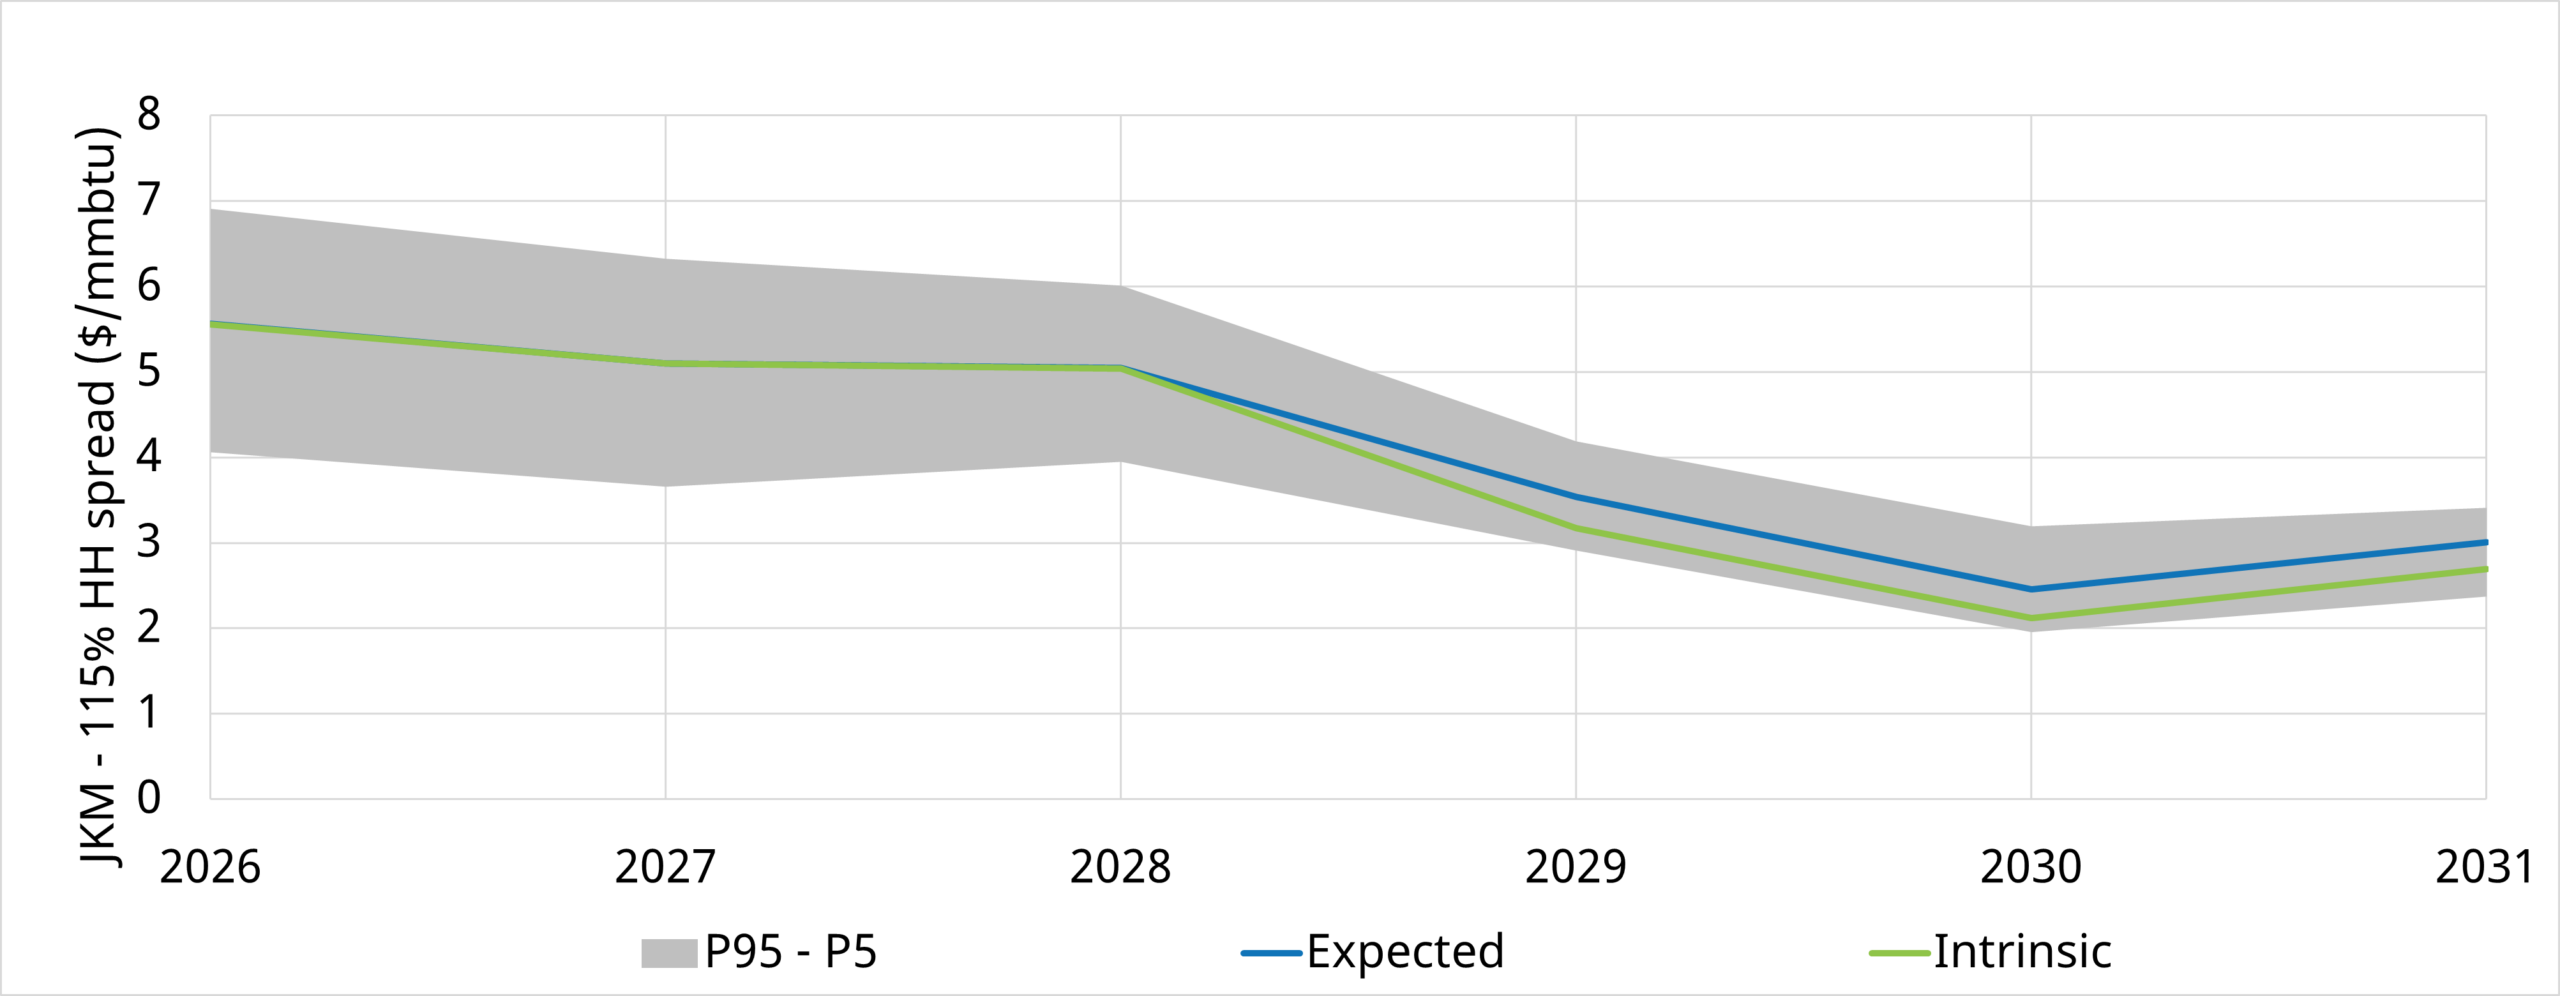
Source: Timera Global Gas Model
Key takeaways from the chart:
- JKM – 115% HH price spread distribution is broader across the 2025-28 horizon, because the US market remains structurally separated from JKM (& TTF) – as a result, HH price volatility directly drives variability in US LNG contract margins (i.e. it is a major risk factor)
- The spread distribution narrows substantially from 2028 as JKM prices converge to US variable export costs – HH price volatility is now being passed through into global gas prices (reducing its impact on US export contract margin variability).
The scenario we show in Chart 2 is just one possible path. Global price convergence could happen more quickly (e.g. by 2027) or take longer (e.g. 2029). But as long as JKM / TTF prices remain separated from the US market, HH volatility remains a major driver of margin variability for US export contracts.
US gas market set to export price volatility
As global gas prices converge, the US starts to export price volatility from its domestic gas market. Swings in HH prices are transmitted directly into fluctuations in Asian & European prices (e.g. JKM & TTF).
This is illustrated in Chart 3, where we show the distribution of the impact of HH price volatility on JKM prices under our illustrative scenario. Again, for this analysis, we have set the model to simulate just HH volatility (with other sources of uncertainty fixed), in order to focus in on the specific impact of HH volatility on JKM prices.
Chart 3: Impact of HH volatility on JKM price
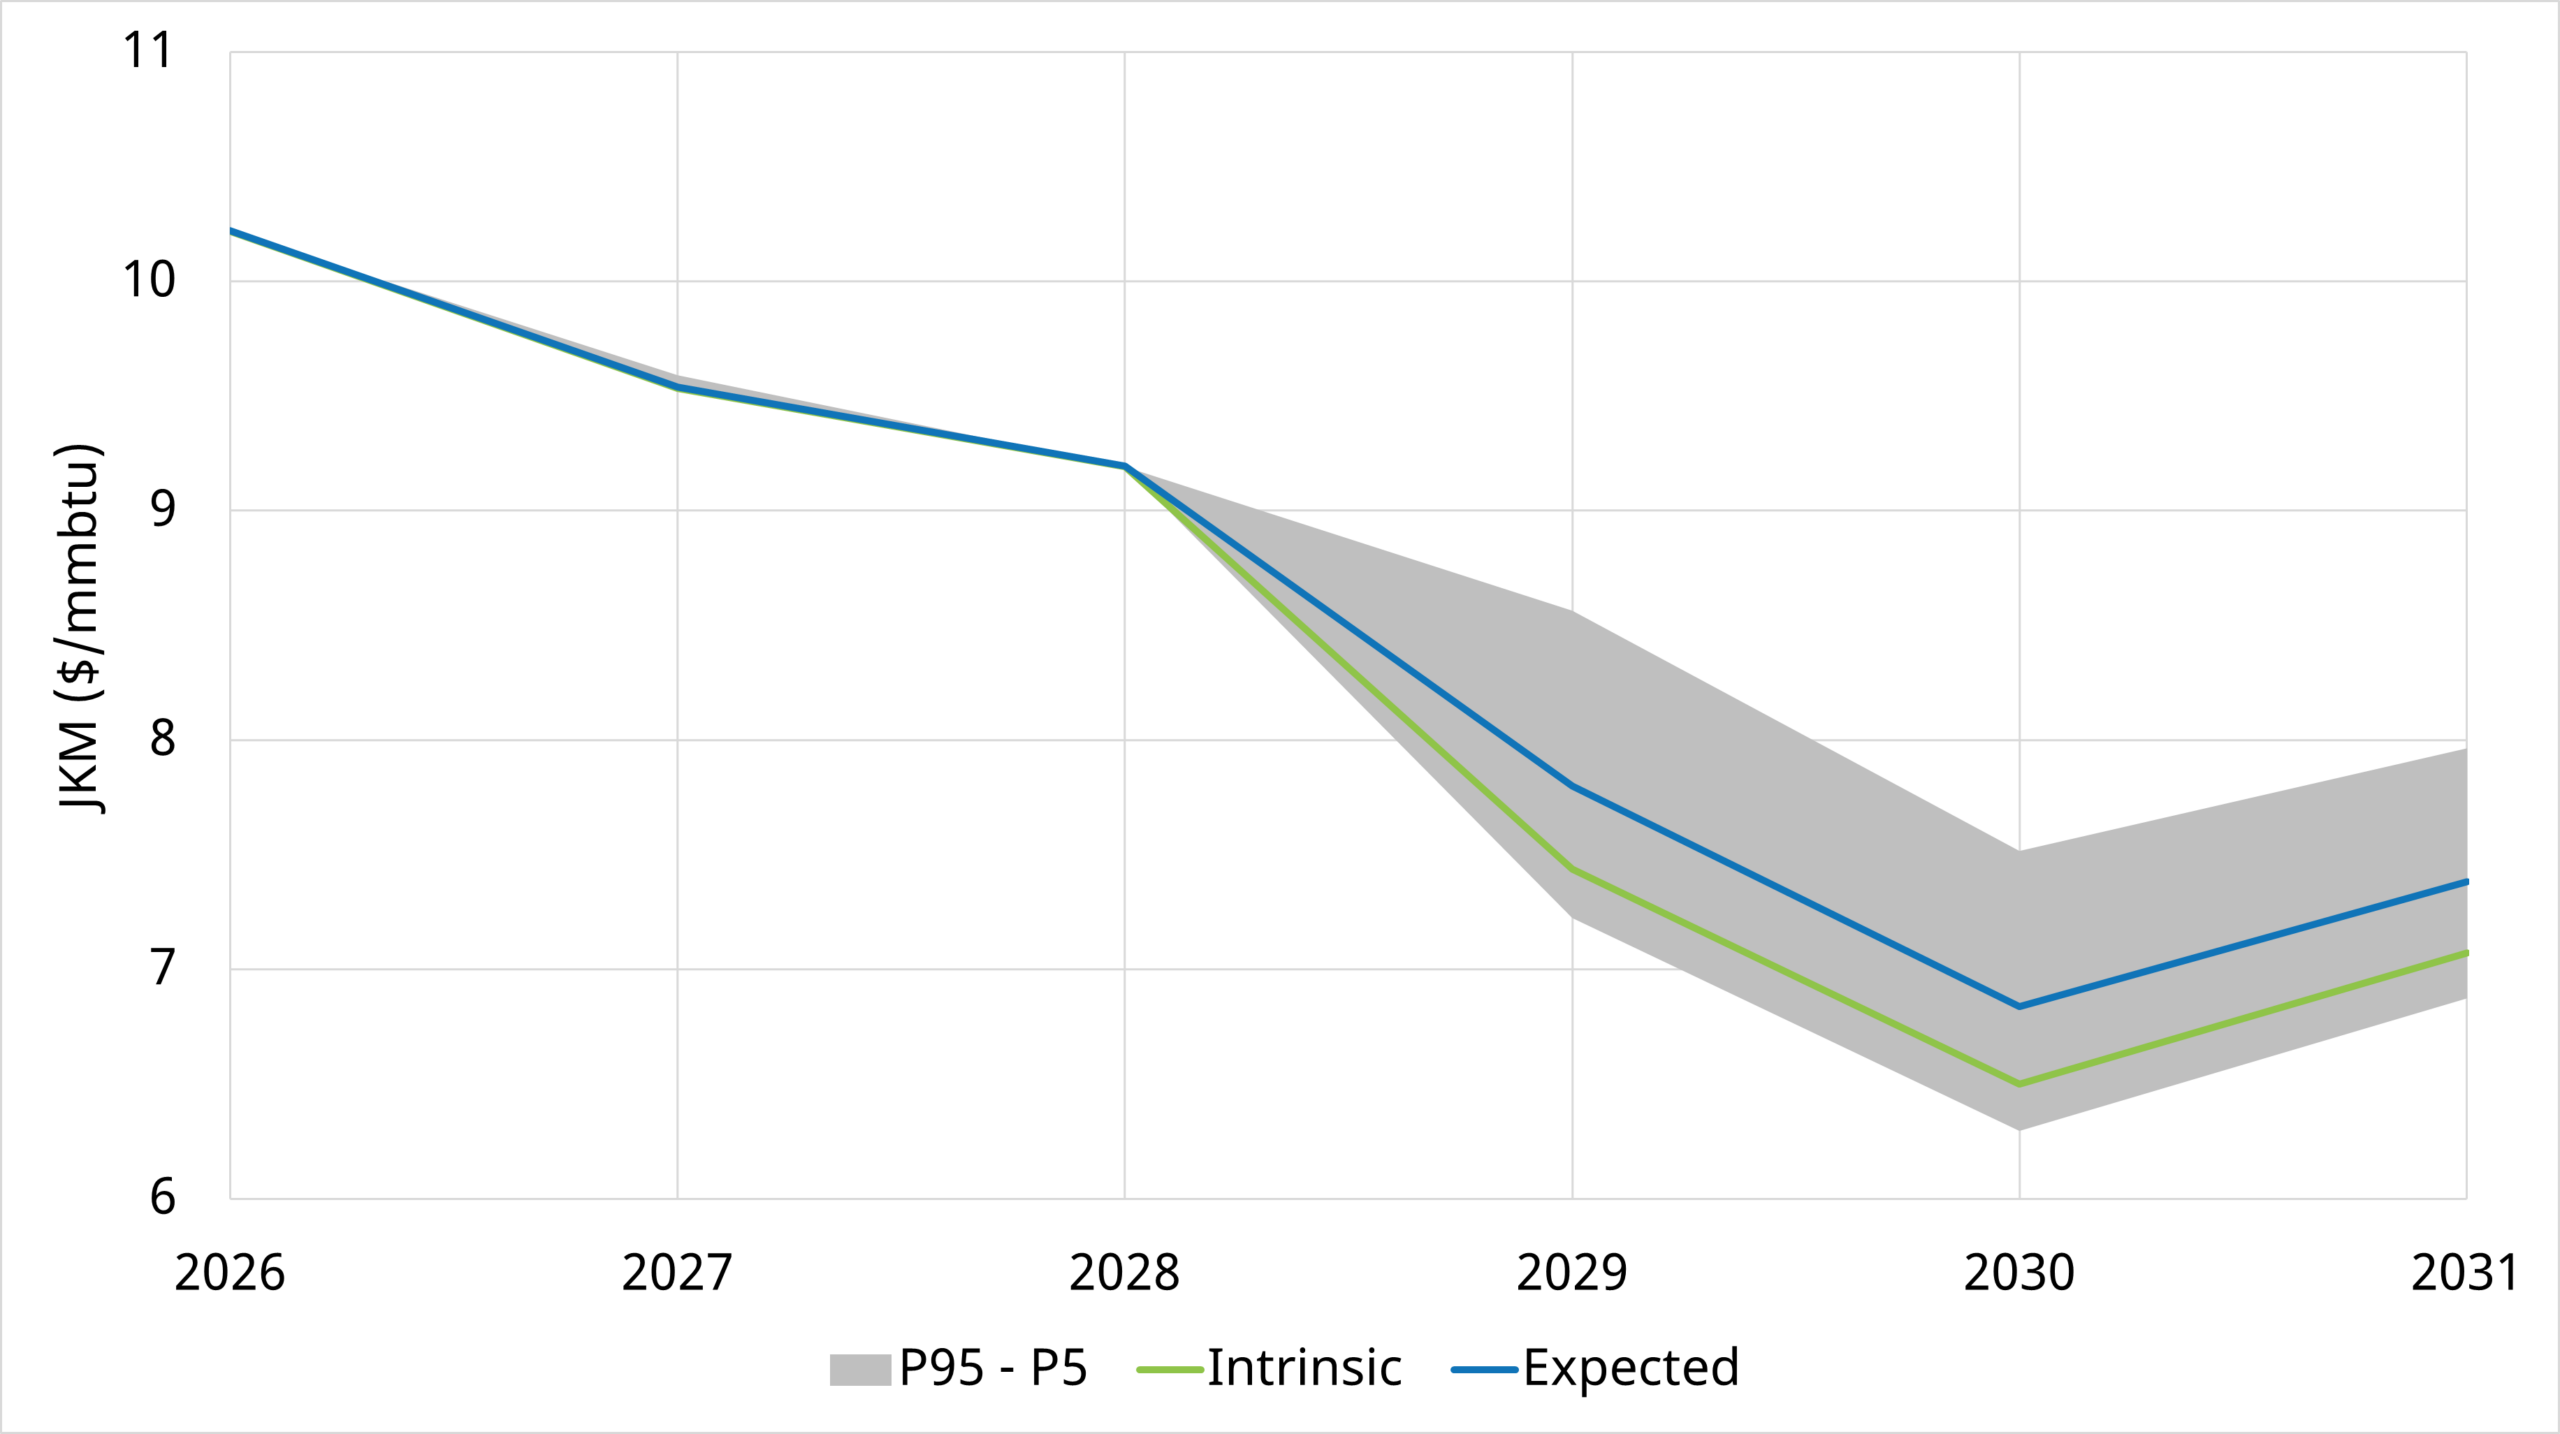
Source: Timera Global Gas Model
Key takeaways from the chart:
- Limited impact of HH price volatility on JKM prices 2026-28, given structural separation of JKM vs HH prices under this scenario
- But as global prices converge from 2028, HH price volatility feeds directly through into JKM price volatility because US LNG is setting prices at the margin, in combination with Asian demand switching
- The impact of proper stochastic modelling of HH volatility produces significantly higher expected JKM prices because:
-
- – When HH rises, US LNG supply is shut in, and therefore global prices need to move higher to balance
-
- – When HH falls, JKM won’t fall with it, as lower HH prices do not induce significant incremental supply.
- In other words, expected JKM prices are significantly higher than an intrinsic JKM price path from a traditional deterministic scenario (see ‘Expected’ vs ‘Intrinsic’ line in the chart).
Global price convergence acts as a volatility transmission mechanism. The result? Volatility in the US gas market will increasingly be exported into the global market.
We have seen across our client base, the LNG market is becoming much more interested in US gas market dynamics, and US gas players are much more interested in the LNG market.
3 commercial conclusions for LNG portfolios
Our illustrative scenario above shows global price convergence by 2028. It could happen faster. We are seeing a strong focus across our clients in understanding the commercial implications of a rapidly shifting market with a substantial range of uncertainty.
Here are 3 commercial implications to consider.
1. Increase in HH influence on LNG portfolio margins
HH volatility is set to become an increasingly important risk factor driving a broader range of LNG portfolio exposures via its impact on global price volatility. As an example, Chart 1 shows the importance of HH price volatility for US export contract margins. Robust modelling of these dynamics to quantify market & asset value impact will drive competitive advantage.
2. HH volatility drives higher expected LNG prices & flex asset value
The asymmetric impact of HH price volatility (shown in Chart 3) translates directly into higher expected LNG prices. HH volatility also supports LNG portfolio flex asset value as it drives global LNG price volatility, which can be monetised via portfolio optionality.
This effect is not captured by traditional deterministic modelling approaches and increases, e.g. the risk that valuations based solely on such techniques underestimate the value of non-Henry Hub indexed supply, which benefits disproportionately from this asymmetric price response.
3. Managing risk of margin compression in US LNG export contracts
US export contract value faces two risks, as we show in Chart 2: (i) HH price volatility drives margin variability and (ii) global price convergence drives margin compression.
Both of these factors make active management of HH exposure increasingly important. This can be via hedging. And also by physical origination activities such as netback gas indexation, net forward HH sales, or diversification of supply and sales away from JKM/TTF.
For more details on our analysis or commercial implications, feel free to contact our LNG & Gas Director, David Duncan (david.duncan@timera-energy.com).
More analysis available via our global gas subscription service
Timera’s global gas subscription service combines intrinsic and stochastic-based price valuations, enabling clients to better assess risk, value opportunities, and make more informed commercial decisions in an increasingly volatile market.
Timera Energy at LNG2026
Timera Energy will be attending and speaking at LNG2026 in Doha from 2-5 Feb 2026.
If you’re attending, we’d value the chance to catch up in person. Please reach out directly to David Duncan (david.duncan@timera-energy.com) or Luke Cottell (luke.cottell@timera-energy.com) to arrange a meeting.
You can also see David speaking on the “Portfolio impact of the LNG supply wave” in the panel discussion at Tues, 3rd Feb, 15:45-17:15, Theatre B.