The flexible structure of US export contracts has been one of the primary drivers of LNG market evolution and liquidity growth over the last 3 years. However the tolling contract structure of US exports is materially different to conventional LNG supply contracts.
“The relative value of ‘diversion flexibility’ and ‘cancellation rights’ strongly depend on prevailing market price curve dynamics.”
US tolling contracts are generally structured with a US hub indexed contract price (Henry Hub being the most common). Contract cost structure typically consists of:
- Feedgas cost (e.g. 100% of Henry Hub price)
- Variable cost (e.g. 15% on top of feedgas price to cover variable costs of liquefaction)
- Fixed tolling fee (e.g. 2-3 $/mmbtu to cover fixed costs of the liquefaction terminal)
More details on US tolling contract cost structure here.
Hub indexed and destination flexible (FOB) US contracts have substantially increased supply flexibility in the global LNG market. This flexibility is enhanced by a liquid US domestic market, where feedgas can be resold in the case of oversupply (i.e. LNG shut ins & cargo cancellation).
US tolling contracts have also added significant portfolio flexibility for market participants, e.g. diversion flexibility, cancellation rights and ability to hedge against liquid gas curves. These benefits come with a key challenge: how to value & optimise contract flexibility.
In today’s article we explore US tolling contract value drivers using a practical case study.
The case study contract & price curves
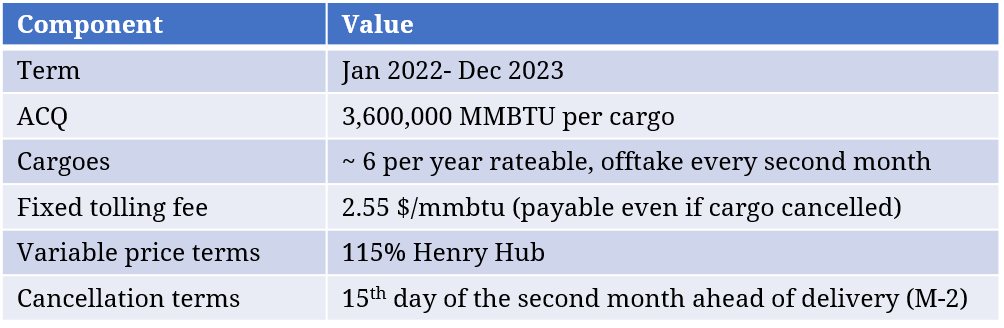
We base our case study around a relatively standard US export terminal tolling structure, over a shorter two year time period (to allow us to focus in on value dynamics). The main contract terms are summarised in Table 1 below, with the contract having a fixed tolling fee and variable cost of exported gas linked to Henry Hub. Cargo cancellation is possible (if US Gulf Coast netback prices fall below the variable price as occurred in 2020).
Table 1: Case study US tolling contract key terms
We value the contract against the price curves shown in Chart 1, based on market forward prices at the end of May.
Chart 1: Market forward curves & netback curves used for the case study

The left hand panel of Chart 1 shows the US variable contract price (in green) compared to the raw forward prices for selling LNG in Asia (JKM) and Europe (DES Nth West Europe). The right hand panel shows how these prices compare on a netback basis to the full contract price i.e. accounting for transport costs from the US Gulf Coast.
The netback curves show that it is more profitable to deliver cargoes to Europe (light blue line) than Asia (dark blue line) across most periods. The exception is in Q1 & Q2 2022 and Q1 2023, when delivery to Asia is more profitable (measured on an intrinsic basis).
Building up contract flexibility value in buckets
In order to value the case study contract we use Timera’s LNG Bridge portfolio model. This model has been deployed by a range of large LNG companies to value and manage LNG portfolio exposures, including US tolling contracts.
To illustrate flexibility value drivers, we build up contract value by modelling 3 cases:
- ‘No flex’ case, where all LNG is delivered to Asia (JKTC via Panama canal)
- ‘Diversion flex’ case with the additional flexibility to deliver gas into NW Europe
- ‘Cancellation rights’ case with the additional flexibility to cancel cargoes (on top of 1. & 2.).
In all cases the contract is modelled as utilising spot market vessel charters (vs time charters).
For each of the 3 cases, the LNG Bridge model simulates a distribution of 500 different potential price paths (around an expected level determined by the forward curves in Chart 1). Contract value is then optimised 500 times, against each individual price path, to generate a distribution of contract value. This allows the measurement of extrinsic value (mean of the value distribution) and intrinsic value (measured against forward curves).
Chart 2 shows the incremental build up of contract value across the 3 cases.
Chart 2: Build up of US tolling contract value by flex buckets
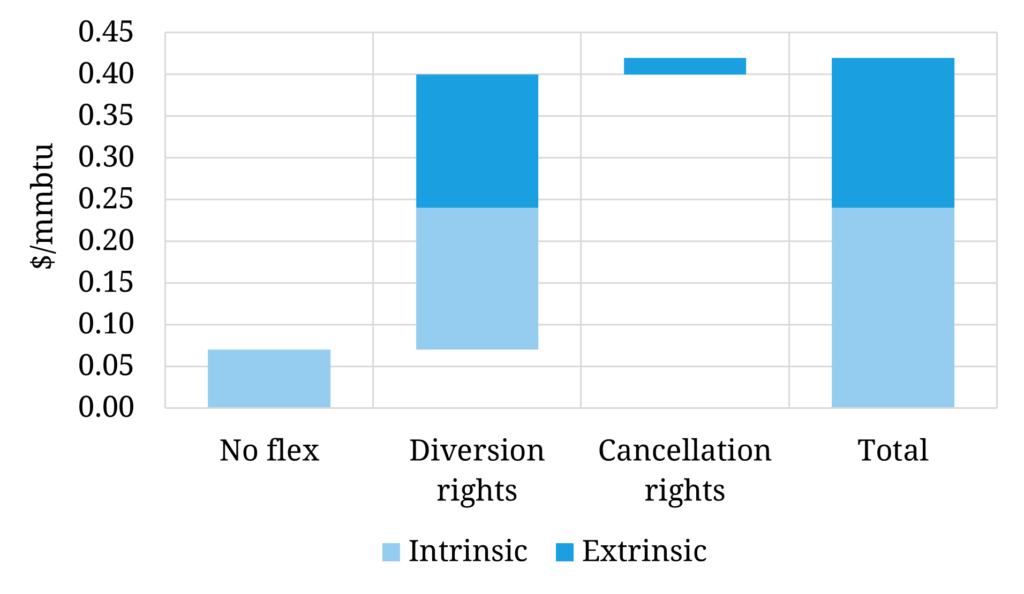
The chart shows the contract is ‘in the money’ by 0.07 $/mmbtu on a ‘No flex’ intrinsic basis i.e. delivering all cargos into Asia. Note this value includes the 2.25 $/mmbtu fixed tolling fee (from Table 1).
The addition of ‘Diversion flex’, allowing cargo delivery into NW Europe, creates 0.17 $/mmbtu of incremental intrinsic value. This is consistent with the netback price curves in Chart 1 favouring NW Europe across a majority of the two year contract horizon, with 8 cargoes going to NW Europe on an in intrinsic basis and 4 cargoes to JKTC (Japan, Korea, Taiwan, China).
There is also significant extrinsic value associated with ‘Diversion flex’ (0.16 $/mmbtu). This is incremental value derived from re-optimisation of cargo deliveries in response to JKM vs NW Europe price spread dynamics deviating from forward curve levels.
Cancellation rights add less incremental value (0.02 $/mmbtu). This is because on a variable cost basis the contract is intrinsically deep in the money i.e. netback prices are substantially higher than the variable cargo cost of 115% HH (as shown in Chart 1).
It is important to note though that the relative value of ‘Diversion flex’ and ‘Cancellation rights’ strongly depend on prevailing market price curve dynamics. For example in 2020 during the Covid market price slump, cancellation rights had significantly higher value as netbacks were crushed in an oversupplied market.
Chart 3 shows an analysis of the case study contract margin distribution from LNG Bridge.
Chart 3: Contract margin distribution
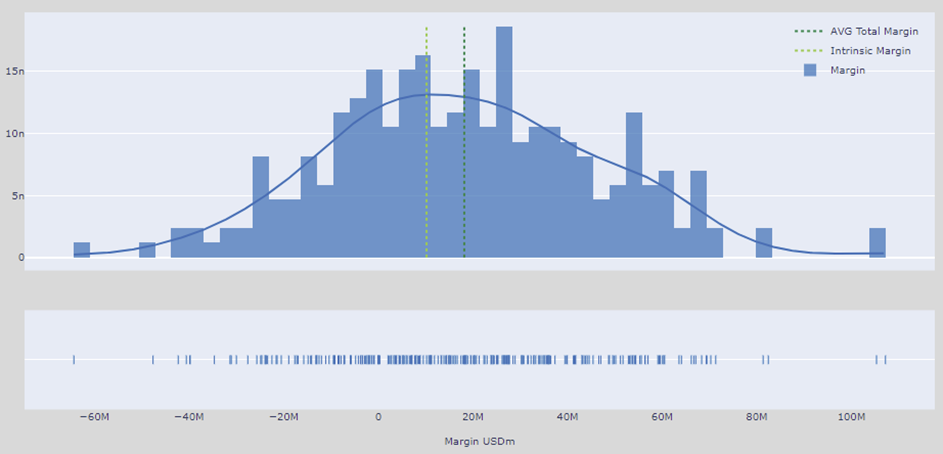
While this distribution is relatively wide on a standalone basis, contract risk can be managed via hedging (e.g. using liquid JKM and TTF curves), although this will act to reduce access to value upside. There can also be offsetting impacts of other positions that dampen the impact of risk on portfolio margin.
Portfolio considerations for a US tolling contract
We value the US tolling contract on a standalone basis for simplicity, but in practice it will sit within a portfolio. The value impact of a US toll on a portfolio is usually significantly different to the standalone value. This is because the high flexibility of US tolls can unlock value from other portfolio components e.g. increasing value capture from a European regas capacity position or enabling access to higher priced periods for Asian sales volumes.
Portfolio shipping dynamics are also important value drivers. We have modelled the case study contract based on spot time charters. Valuing a US toll on a dedicated vessel basis can significantly alter results. For example:
- When market price spreads increase (e.g. JKM vs NW Europe), incremental value often goes to shipowners – vessel time charter (VTC) protects against this
- VTC can reduce diversion & cancellation flex, as shipping costs are sunk
- Flexibility in delivery windows during the ADP process can add additional value to target curve contango, as well as risk mitigation for the impact of canal congestion on scheduled vessel rotations.
US tolling contracts can also unlock value from portfolio additions (e.g. additional sales contracts or regas capacity) and market & logistical outcomes (e.g. Panama canal delays or structural shifts in pricing dynamics). These are common incremental cases our clients analyse in LNG Bridge to better understand portfolio value behaviour.
US tolling contracts have had a transformational impact on the LNG market in providing flexible supply that strongly influences marginal pricing across regions. But it is easy to underestimate how much the value of a US toll depends on interaction with the portfolio in which it sits.
If you are interested in more information on LNG Bridge see: