European gas prices for this winter surged more than 40% last week. There were various supply side issues that made headlines e.g. Australian LNG strikes, the Middle East conflict & suspected sabotage of a Baltic pipeline. But there is a more structural issue behind rising prices.
The European gas & LNG markets remain in a structurally tight regime post Russian supply cuts. Russian supply losses have exceeded LNG supply growth, leaving markets supply constrained and balancing on demand.
Prices are being set at the intersection of inelastic supply & demand curves. And this means relatively small changes in market balance have a big impact on prices.
Europe survived last winter better than anyone expected. But the first slide of our recently published Timera Global Gas Report summarises the current market state of play: ‘the gas crisis is not over’.
In today’s article we set out a numerical analysis of the European gas market winter balance and flag some key risks.
The state of play
Wind the clock back 12 months and the world was focused on Europe’s ability to survive its first winter after losing almost all Russian pipeline supply.
Europe did OK due to a combination of mild weather & steeply declining demand. In fact the European gas market exited winter with a large storage inventory overhang that has subdued prices in 2023 (vs extreme crisis levels in 2022).
Storage inventories are currently at record levels. European gas demand is running at 15-20% below pre-crisis levels, in part due to aggressive destruction of demand across Europe’s industrial base. So everything is under control for this winter right?
Not quite. It is easy to be lulled into a false sense of security looking ahead into winter. The gas market remains in a tight regime into 2024-25, until the next wave of supply hits the market in 2025-26.
Another mild winter and continued weak demand and Europe should be OK. But there are asymmetric upside risks to prices, particularly if there is an icy winter in Europe or Nth East Asia or any material supply disruptions occur.
What happened last winter?
It is useful to start with winter 2022-23 to frame the challenges across the winter ahead. Chart 1 shows a breakdown of supply & demand balance across last winter and the ‘End of Winter’ (EoW) storage inventory.
Chart 1: European gas market balance across winter 2022-23

Source: Timera Energy, IEA, Eurostat, LNG Unlimited; Europe defined as EU 27 + UK + CH
Europe entered last winter with close to 5yr average stock levels. Despite a nearly 50 bcm drop in Russian flows YoY, Europe ended winter at the top of the 5yr range due to:
- A demand drop of ~18% vs 5yr average, led by a non-power demand drop of ~20%, driven by mild weather & demand destruction from high prices
- an increase in LNG imports of 24 bcm YoY.
Our projection for last winter was for a 55 bcm End of Winter storage inventory level in an ‘optimistic’ scenario – Europe survived even better with an additional 1 bcm in store.
A scenario to frame this winter
This winter is challenging, particularly given substantial demand uncertainty. There are the usual weather related issues. But what is unclear is the extent that general economic weakness will translate into continued weak gas demand.
In Chart 2 we set out a scenario for European gas market balance this winter.
Chart 2: European gas market balance scenario for winter 2023-24
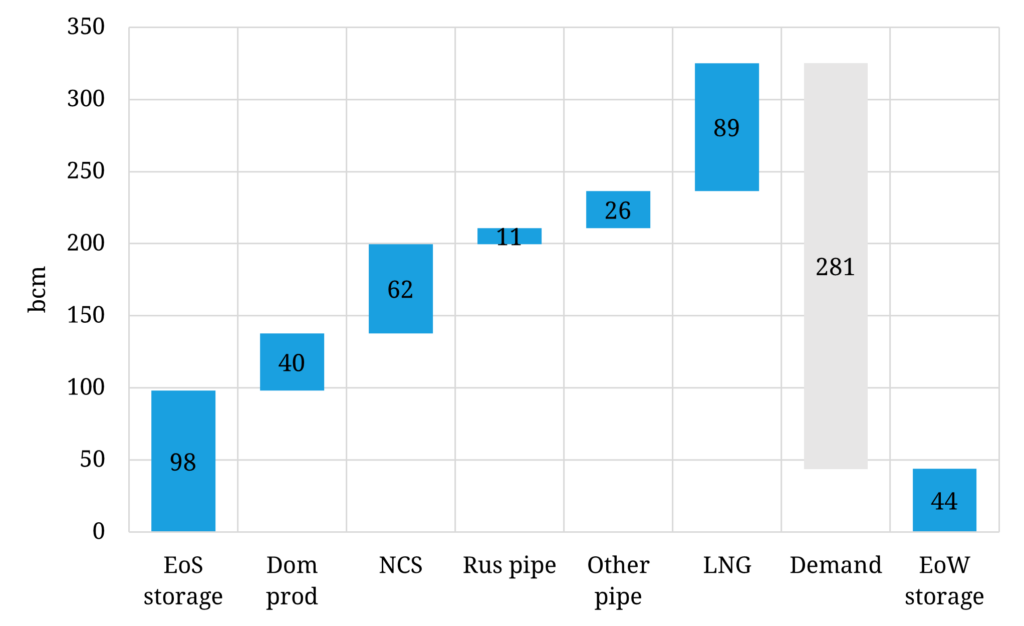
Source: Timera Energy global gas model; EoS = End of Summer, EoW = End of Winter
Let’s summarise some key assumptions behind this scenario:
- We assume demand is higher vs last winter by ~25 bcm YoY, mainly led by power demand, reflecting more normal winter temperatures & some power sector demand pick up (e.g. due to coal/nuclear retirements & lower gas price levels)
- In terms of key supply sources we assume:
- Storage: +9bcm YoY (entering winter)
- LNG: + 4bcm YoY, balancing Europe & Asia – strong dependence on Asian demand (see key risks below)
- Domestic & NCS prod relatively flat (Groningen down, NCS up slightly)
- Russia: remaining volumes down 1bcm – limited further squeeze YoY. Key risk of flows into SEE (c. 10bcm over winter)
- Other pipeline supply: + 3bcm (TAP / Nth Africa).
In summary, if conditions turn out to be normal this winter, Europe should have ample gas to make it through to spring. But storage inventories at the end of winter are likely to be significantly lower than last year (12 bcm YoY in the chart scenario), supporting continuation of the tighter market regime in 2024.
What does this mean for prices?
One of the key characteristics of a tight market regime is that small changes in market balance can cause big moves in price. This is driven by current conditions of inelastic demand & supply setting marginal prices as we set out recently.
Market risks are by nature bi-directional. Prices can rise or fall from current levels. But our latest modelling of European gas market evolution across this winter and into 2024 shows asymmetric upside risk for prices.
Downside risks definitely exist e.g. in the form of a negative demand shock from a sharp recession, or even just from another mild winter & healthy supply volumes. But downside price risk is buffered by price support from substantial coal for gas plant switching volumes across the European power sector & by the fact that European & Asian gas demand are already so weak.
Our modelling not only shows a higher probability of tighter gas market balances into 2024, it also shows asymmetric upside for price risk given the inelastic nature of both supply & demand response.
In Table 1 we set out 5 key risks that could drive prices significantly higher this winter, eating into the 44 bcma End of Winter storage buffer we show in Chart 2.
Table 1: 5 key potential drivers of upside gas price risk this winter
Source: Timera Energy
Time to show a respect for uncertainty
Our global gas model is built to analyse uncertainty. We are not forecasting the events in Table 1, but we want to understand what the price impact would be if they occur (& similarly with downside price risks).
You can see a detailed analysis of these risks on market prices in our Global Gas Report or join us for further discussion in our webinar on Tue this week. But in summary, both the European gas & LNG markets are set to remain volatile across this winter and 2024-25, with price risk skewed to the upside.
The risks we set out in Table 1 could see prices move significantly higher, to levels required to induce inelastic demand response (either in Europe or Asia). Additional European regas capacity has substantially reduced the risk of supply shortages in Europe this winter. But Europe is not yet out of the woods when it comes to gas market tightness.
For a sample copy of our recently released Global Gas Report feel free to contact David Duncan (Director of LNG & Gas) david.duncan@timera-energy.com
Join our upcoming webinar
Title: “A new lens” – how shifting pricing dynamics are set to drive LNG portfolio value
Date: Tues 17th Oct 09:00 BST (10:00 CET, 16:00 SGT)
Registration link here, free to attend
Focus:
- Market regime shift set up from 2024 into 2030s
- Marginal drivers of regional price spread evolution (e.g. HH vs TTF vs JKM)
- Evolution of price volatility & correlation + value impact
- Why crude vs gas pricing is set to be a big LNG portfolio value driver
- Brent SPA case study quantifying valuation breakdown