Ancillary service revenues have underpinned the GB battery revenue stack to date. However as BESS capacity grows, evidence of ancillary market saturation is emerging fast. This is driving a structural transition in the revenue stack away from ancillaries towards energy arbitrage.
“Battery energy arbitrage revenues have surged across the last 2 years”
We recently published an article focused on evidence of ancillary saturation & its implications for GB BESS investors. In today’s article we focus on quantifying the level of energy arbitrage revenues given these are set to dominate GB BESS returns from 2023.
One of the challenges with ancillary revenue dominance across the last two years is a lack of clean benchmarks on achievable levels of energy arbitrage revenues. Today we backtest revenue capture across the 2018-22 period for a battery using an energy arbitrage strategy. We also compare this to a Dynamic Containment strategy revenue benchmark.
Backtesting energy arbitrage strategy returns help to shed important light on how BESS returns may change going forward.
Revenue transition – ancillaries to energy arbitrage
GB battery returns to date have been dominated by ancillary services. This was first via battery focused Enhanced Frequency Response (EFR) contracts in 2016, then via the Firm Frequency Response (FFR) market and since Q4 2020 via Dynamic Containment (DC) products.
Until 2022, the demand for ancillary services has structurally outpaced the supply of battery capacity coming online. This has supported the dominant role of ancillary returns.
On the flip side there have been some significant barriers for energy arbitrage value capture across the last few years including:
- Expensive ‘double charging’ of BSUoS (variable balancing charges), eroding arbitrage value
- Balancing Mechanism access & call off constraints, limiting ability to capture the sharpest market price signals
- Higher cell capex costs favouring lower cycling ancillary services given degradation impact.
These barriers have however now to a large extent fallen away, with double charging removed (in Apr 2021), reforms to improve BM access and a reduction in degradation cost uncertainty & cycling constraints.
The removal of these barriers and rapidly approaching ancillary saturation is shifting battery investor focus to energy arbitrage revenue performance.
How has an energy arbitrage strategy performed?
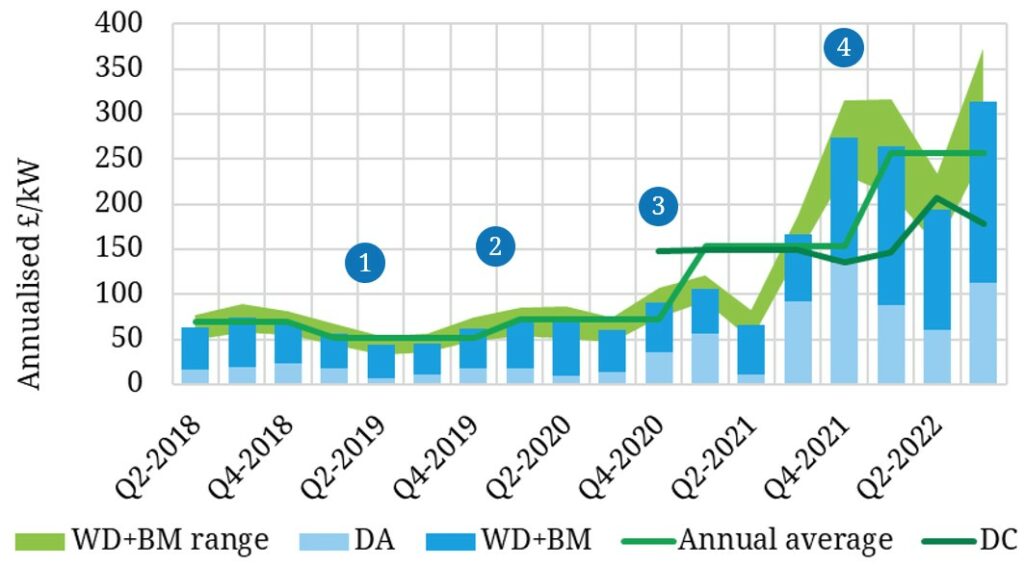
Let’s turn to the numbers. In Chart 1 we show backtesting analysis for a 2-hour duration battery under two optimisation strategies:
- Pure energy arbitrage: the blue bars show achieved revenues for a battery fully focused on energy arbitrage
- Pure DC: the dark green line shows return from a Dynamic Containment only strategy (as a simple ancillary revenue benchmark)
Chart 1 shows 4 key phases of energy arbitrage revenue evolution:
- 2017-19: A relatively well supplied power market with higher nuclear, CCGT and coal availability acts to supress volatility & intraday price spreads. The limited volume of BESS assets in operation are focused on FFR / EFR ancillary services.
- Q1–Q3 2020: The COVID induced demand slump saps value out of the Day-Ahead market. However an increase in intraday volatility increases revenue capture from Within-Day (WD) & BM optimisation.
- Q4 2020 – Q2 2021: The GB market tightens given lower CCGT availability (e.g. Calon assets), lower nuclear availability (in both GB & France) and reduced IFA interconnector capacity. Energy arbitrage returns rise as a result however this is trumped by the introduction of the DC service with premium returns.
- Q4-21 onwards: The energy crisis hits an already tight market and prices surge. Energy arbitrage returns for a 2hr battery exceed ancillary service returns on an expected monthly basis for the first time. Sharp increase in intraday and BM volatility. Increasing BESS capacity starts to weigh on ancillary service returns.
There are several important points to note in interpreting this analysis:
- We show backtested revenues for a 2-hr battery in the chart. DC revenues for shorter duration batteries (e.g. 1 hour) are significantly higher relative to energy arbitrage (illustrating that shorter duration batteries are set to dominate ancillaries going forward).
- The ‘Pure DC’ strategy benchmark we show (dark green line) can be improved upon by a more sophisticated ancillary strategy e.g. including DC stacking & FFR. We have used a clean DC benchmark for simplicity.
- Similarly the ‘Pure energy arbitrage’ strategy can be improved upon via a ‘Hybrid’ ancillary plus energy arbitrage strategy. We show the ‘Pure energy arbitrage’ strategy as the cleanest benchmark for future revenue stack behaviour in a market with ancillary saturation.
- The BM component of backtested revenues across the 2018-22 horizon assumes a ‘NIV chasing’ strategy to capture cashout price volatility (which has been the dominant strategy across this horizon). On a forward basis we model BM revenues based on accepted BM bids & offers (set to dominate future real time revenue capture).
All of this accounted for, the backtest results point to some interesting conclusions. Most importantly, BESS energy arbitrage revenues have surged across the last 2 years as the GB market has tightened and wind & solar output increased.
Arbitrage returns are more variable than the relatively stable DC revenue stream (pre-saturation). Within-day and BM returns are an important driver of the arbitrage revenue stack given price volatility increases closer to real time.
In summary, the energy arbitrage fundamentals behind ancillary revenues are strong (caveat the risks around high volumes of new capacity coming online by 2025-26).
How do we backtest BESS revenues?
It is easy to draw lines on a chart. The value of battery revenue analysis is only as good as the model that underpins it. So here is a brief summary of how we model battery revenues.
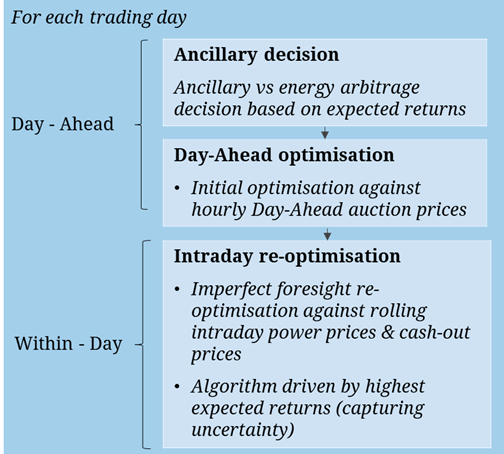
We use the same stochastic battery dispatch optimisation model for both backtesting and revenue projection. This model is designed to replicate the decisions a battery optimiser faces in reality. These include a lack of perfect foresight, price uncertainty and an ability to trade against available products at each point in time (e.g. Day-Ahead auction, continuous Within-Day & BM bids & offers or cashout prices).
Our backtest modelling approach is summarised in Diagram 1.
For our backtesting analysis we use actual outturn Day-Ahead auction prices. We then capture Within-Day (WD) price uncertainty by simulating hundreds of WD price paths, anchored around published volume weighted average, high and low WD prices. This enables more realistic capture of the WD price uncertainty & variability faced by battery optimisers.
5 key takeaways
We conclude with 5 takeaways from our backtesting analysis for battery investors to consider:
- Ancillary saturation is approaching fast
- Shorter duration batteries are set to dominate ancillaries as these markets saturate
- Energy arbitrage revenues are strong behind current DC revenue support
- However arbitrage revenue variability is higher (e.g. month on month, quarter on quarter)
- Within-Day & Balancing Mechanism revenues are set to play a much more important role going forward
To see more of our analysis on GB BESS value drivers you can join our free webinar this Thursday (see details below).
WEBINAR: “Beyond ancillaries” – structural shift in GB battery revenue stack from ancillaries to energy arbitrage
Time: Thu Nov 24th, 2:00-3:00pm GMT.
Register for our free battery webinar via this link, we will be covering
– Evidence of ancillary service revenue saturation (DC, FFR)
– Surging ‘energy arbitrage’ price signals (intraday price shape & volatility)
– Growing importance of Balancing Mechanism in driving BESS revenues
– Backtesting analysis of GB BESS asset revenue capture (2018-22)
– State of play: key BESS investment case drivers & risks