“Backwardated, but still elevated –with Asia doing the clearing”
The closure of the Strait of Hormuz has reset global gas market price levels and volatility, although the forward curve continues to signal a de-escalation through the back half of 2026. Below we walk through five charts that frame the current state of play, the supply-demand response, and the implications for European winter readiness.
1. Prices remain elevated, but heavily backwardated
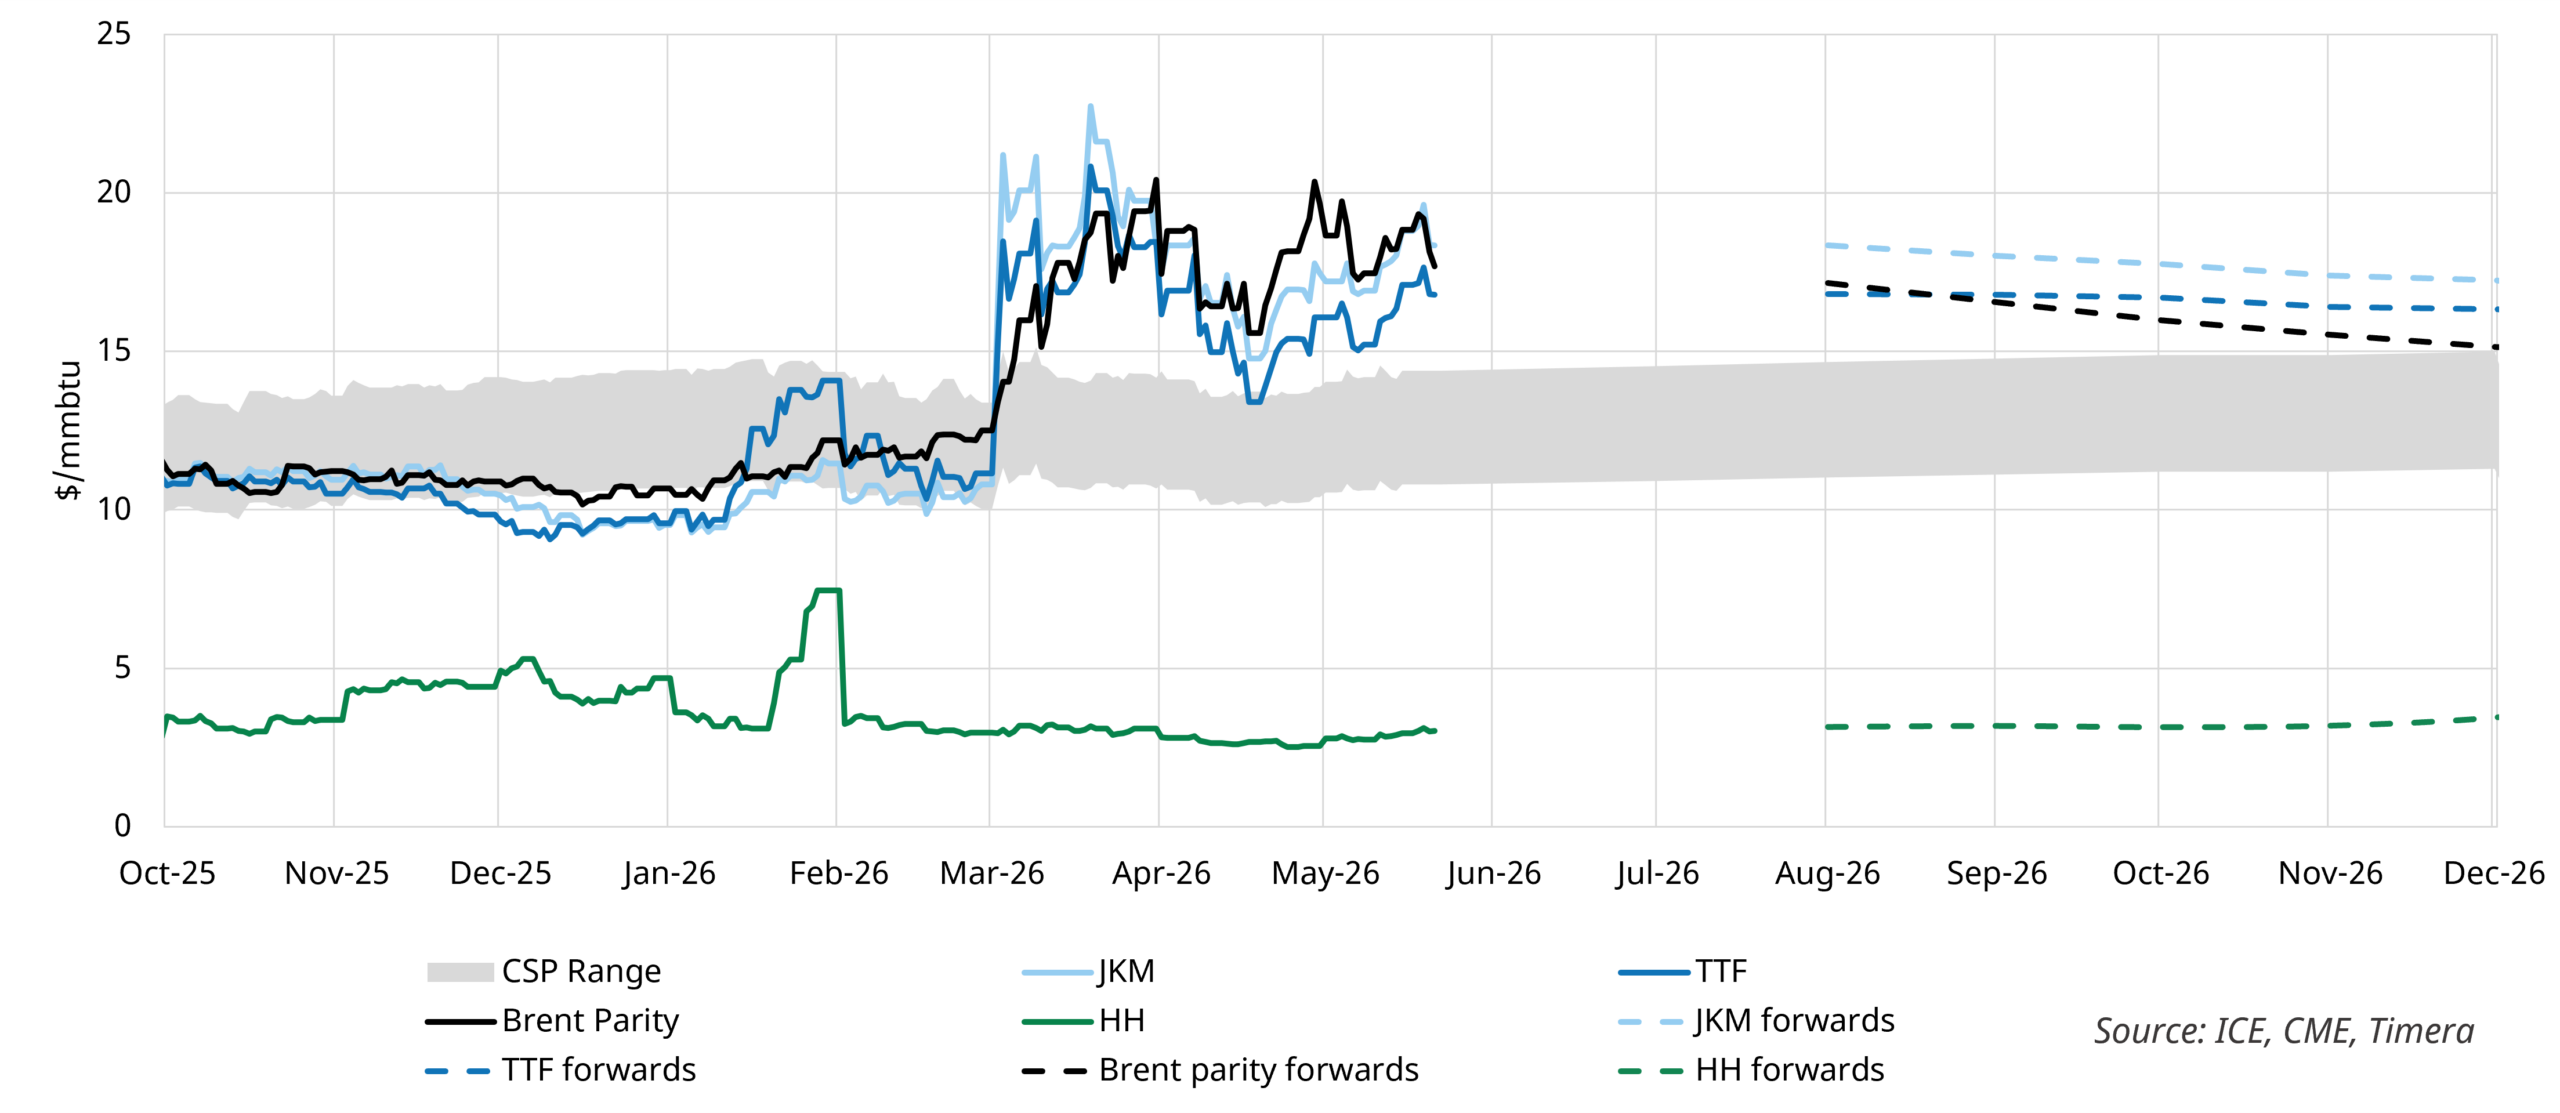
Front-month benchmarks had been anchored in a $10–12/mmbtu range prior to the conflict. Since early March, prompt prices have stepped up to a $14–20/mmbtu range, with a sharp increase in realised volatility.
Chart 1: Global gas price benchmarks (JKM, TTF, Brent parity + forwards, vs CSP range)
Source: ICE, CME, Spark, Timera
Chart 1 shows TTF is now trading firmly above the European CTGS window, implying displacement of gas-fired generation and a step-up in European power sector coal burn. The forward curve, however, points to de-escalation through Q4, with global gas benchmarks converging back toward the upper end of the CSP range by year-end.
Meanwhile, the future curve shows global gas prices trading above Brent parity, incentivising more oil uptake to substitute for Asian LNG demand as the crisis unwinds. This helps allow for destination-flexible LNG cargoes to stay within Atlantic Basin, supporting European refilling, although Brent upside along the curve remains a bullish risk.
2. Asian demand response is clearing the market
Asia is bearing the disproportionate weight of the disruption, particularly given the loss of baseload Qatari and UAE contracted volumes.
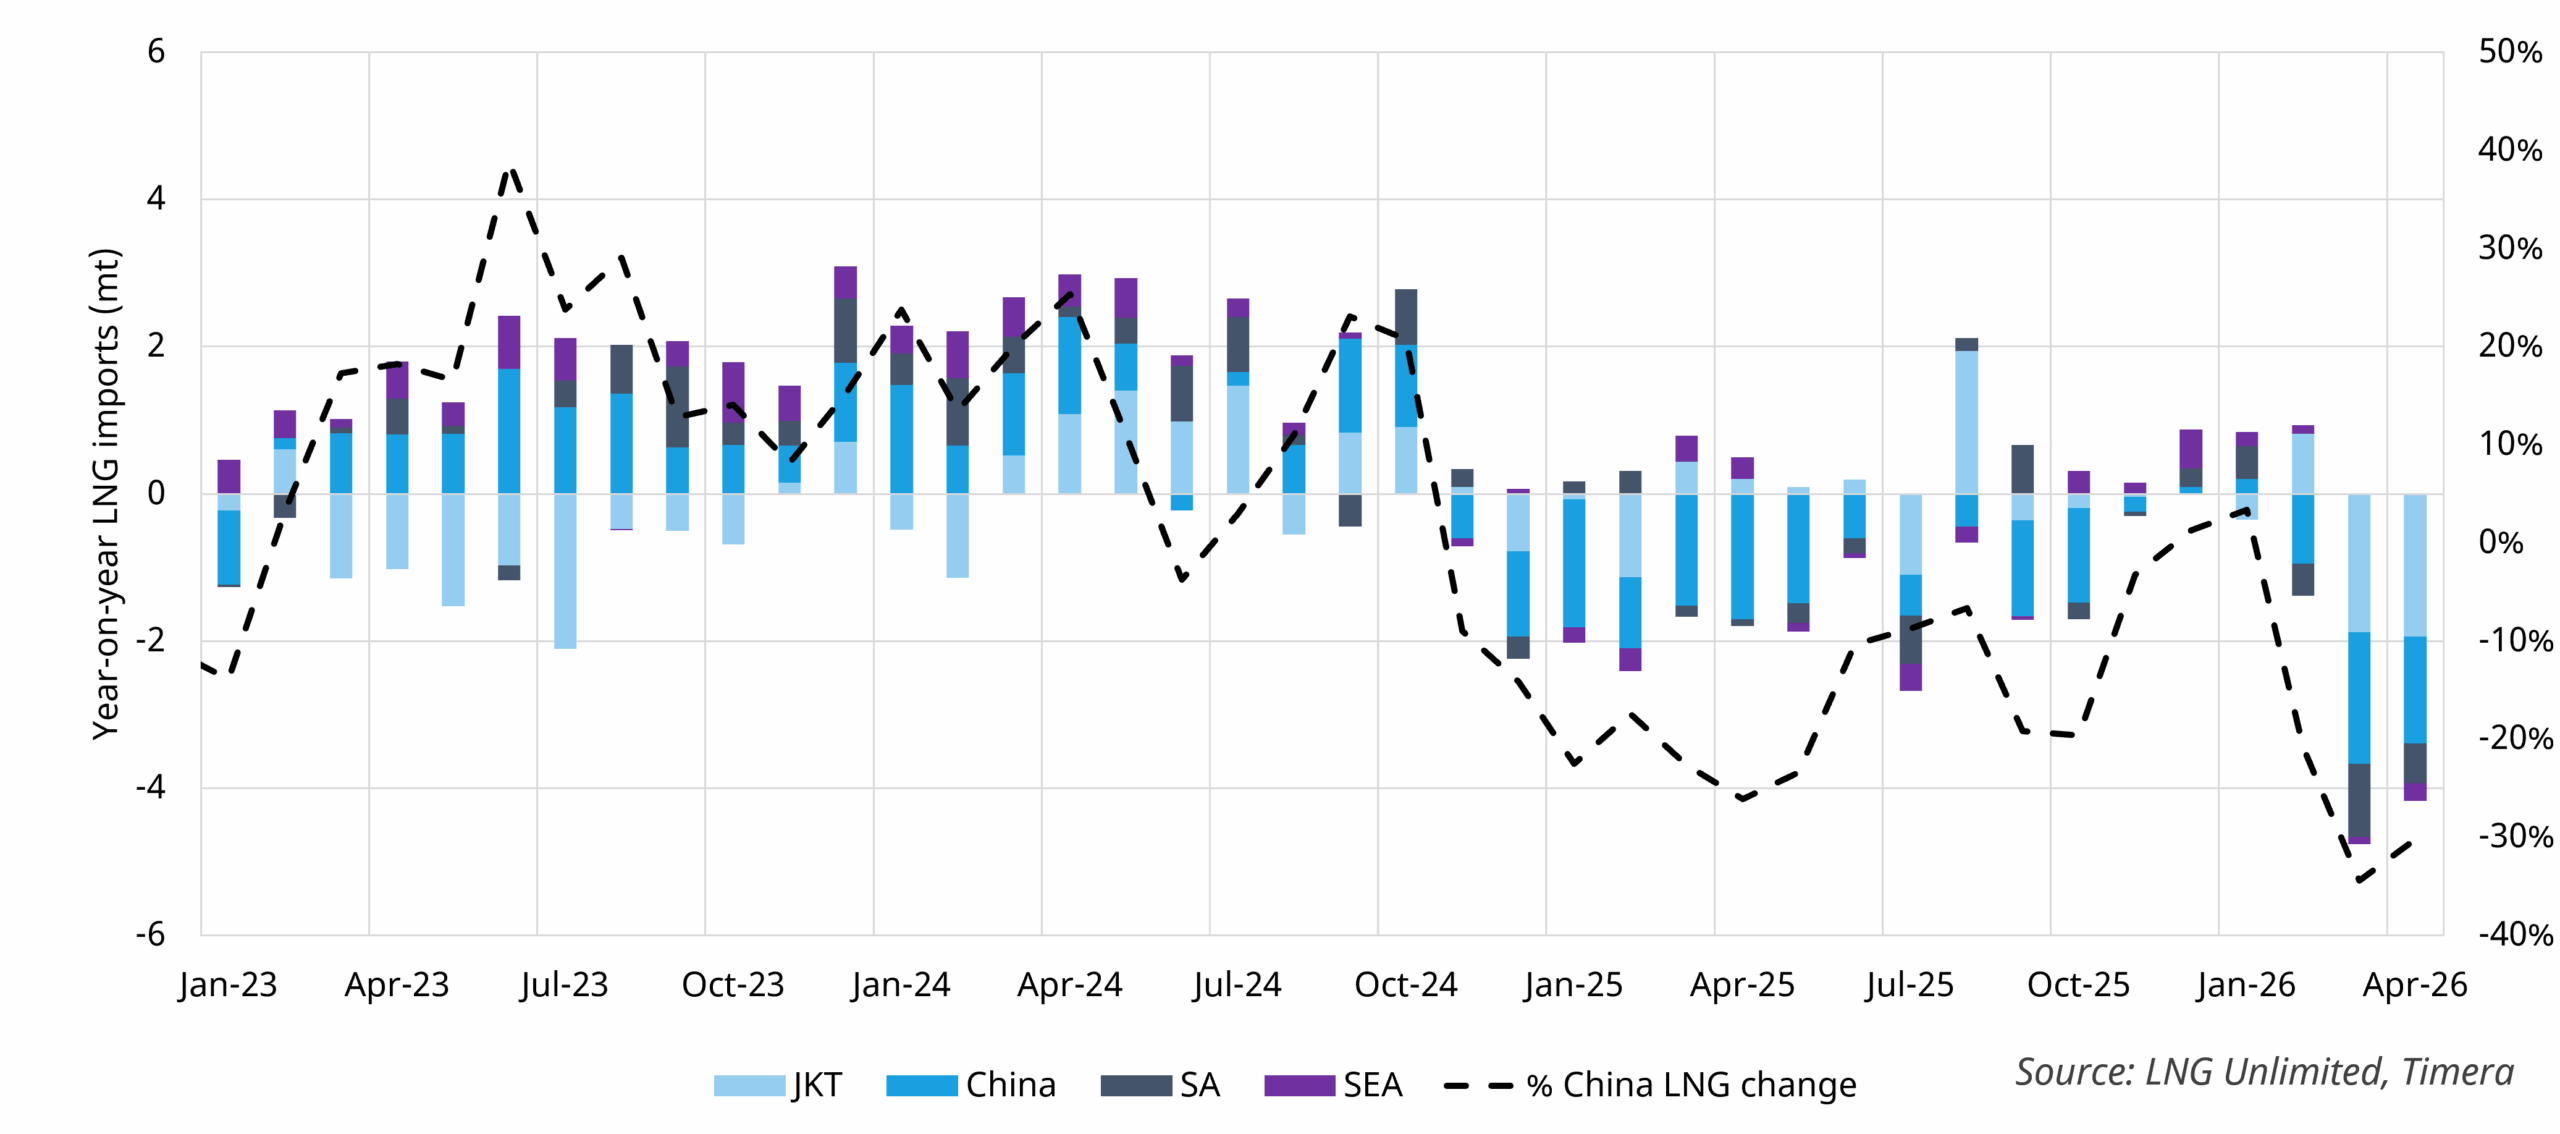
Chart 2 · Year-on-year Asian LNG imports by region, with China % change overlaid
Source: LNG Unlimited, Timera
Chart 2 sets out the year-on-year evolution of Asian LNG imports. Japan and Korea have boosted coal-fired generation, supported by shorter term easing of coal policy restrictions. The South Asian response has split: Bangladesh has been active in the spot market backfilling lost cargoes, while Pakistan imports have collapsed as prices have moved up a strongly price sensitive demand curve, resulting in significant power sector demand destruction. India has resorted to some spot purchases to backfill lost capacity but has seen a notable reduction in industrial gas demand as LNG imports dropped.
The standout has been the elasticity of Chinese LNG demand with imports down ~30% across Mar/Apr 2026. Two drivers are at work.
First, pre-crisis underground stocks and near-full LNG inventories supported a structurally bearish counterfactual; China has leaned on storage flexibility through the early phase, however like Europe, this acts to delay demand and push tightness down the curve, with China likely to see stronger Q3 LNG demand to support restocking.
Second, a ban on domestic oil exports has kept Chinese crude onshore at a discount to offshore, materially enhancing industrial gas-to-oil switching economics. This flexibility is not replicable elsewhere, where switching capability broadly remains anchored to Brent vs. LNG competitiveness (relatively unchanged versus pre-crisis). Our snapshot here has more on China’s LNG demand reaction to the crisis.
3. Asian price premium versus Europe
With the Strait closed, JKM has priced aggressively higher versus TTF to pull Atlantic Basin cargoes east and substitute for lost Qatari supply. Spiking freight rates have amplified the cross-basin premium.
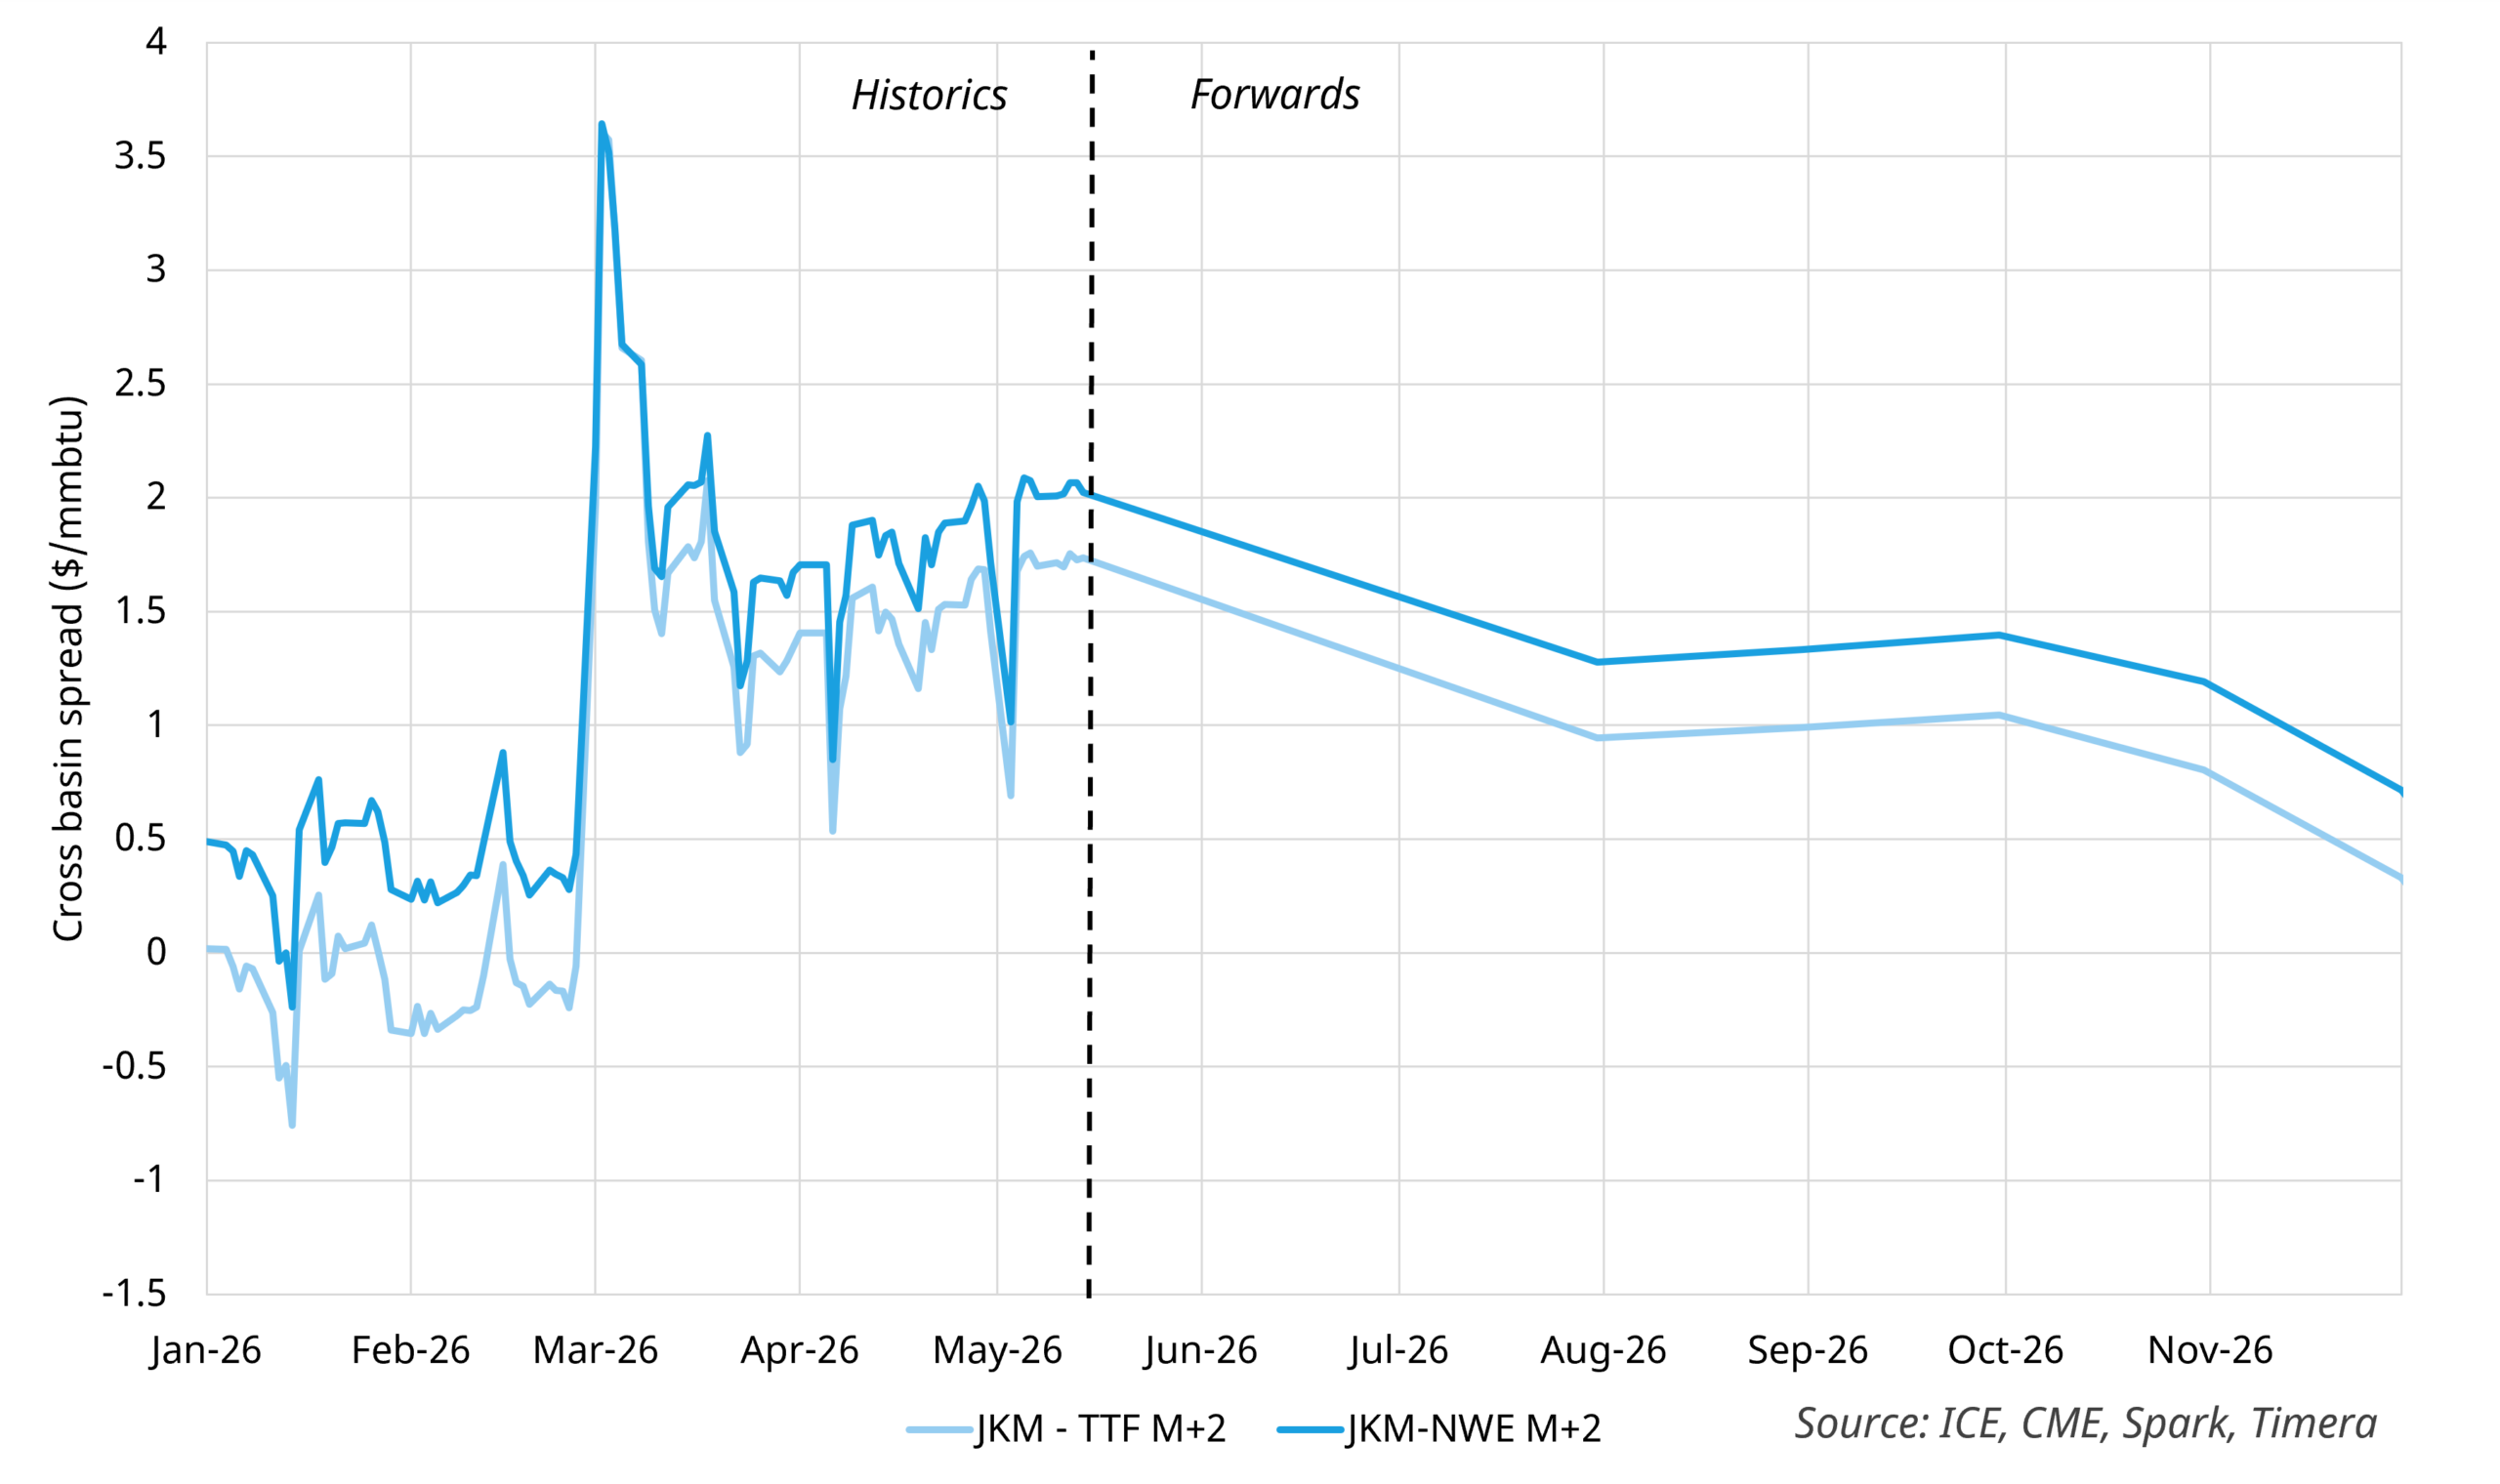
Chart 3 plots the M+2 JKM–TTF and JKM–NWE spreads, both of which spiked above $3/mmbtu in early March before settling into the $1.5–2/mmbtu range across May.
Chart 3 · Cross-basin spreads M+2 (JKM–TTF, JKM–NWE)
Source: ICE, CME, Spark, Timera
The forward curve points to a narrowing JKM–NWE spread into Q3, suggesting the market is pricing a fade in the Asian premium. This is likely contingent on a resolution that reopens the Strait.
With freight rates sitting flat across the curve, and forward cross – basin spreads narrowing, Europe is signaling to price in a greater volumes of US LNG into the Atlantic through the second half of the year.
4. European pricing reflects regas capacity constraints
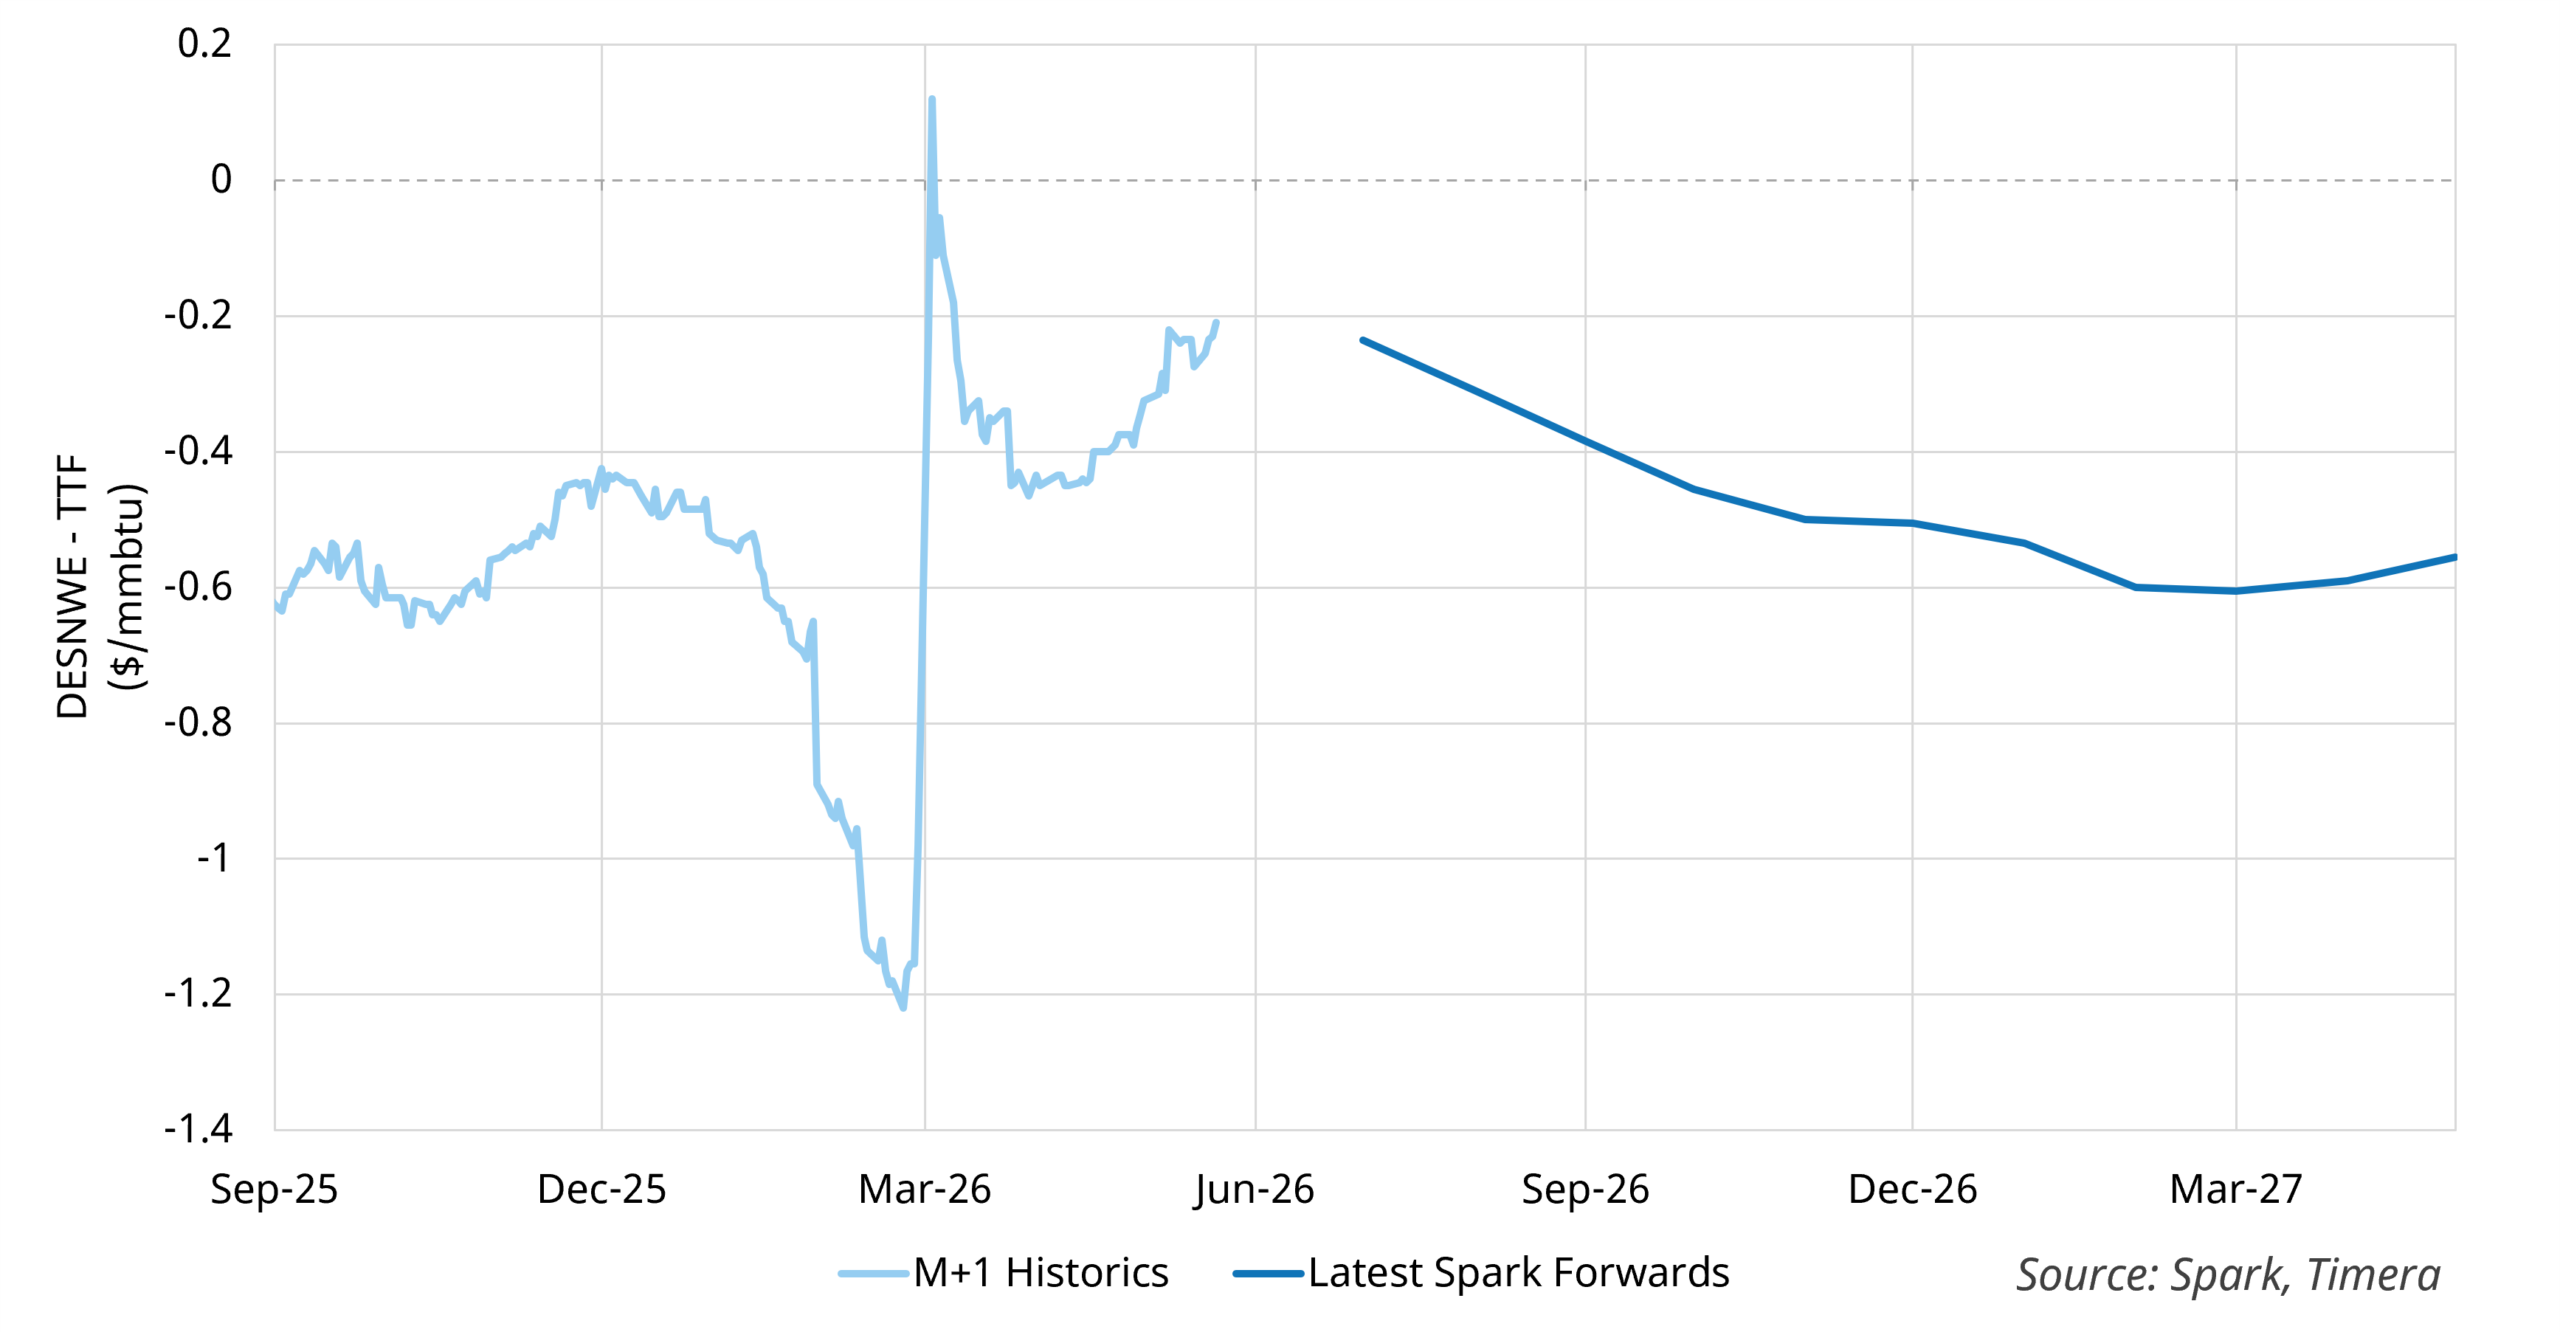
Increasing European LNG demand down the curve is also evident in offshore LNG – onshore gas spreads.
Chart 4 shows the DESNWE–TTF M+1 basis widening from a current $0.2-0.3/mmbtu range to $0.6/mmbtu down the curve, as the market prices in tighter regas capacity into Q3
Chart 4 · DESNWE–TTF M+1 basis evolution + forwards
Source: Spark, Timera
We set out in this article the European regas capacity value framework with the DES NWE–gas hub spread as the key value driver.
5. Tough for Europe to refill storage ahead of winter
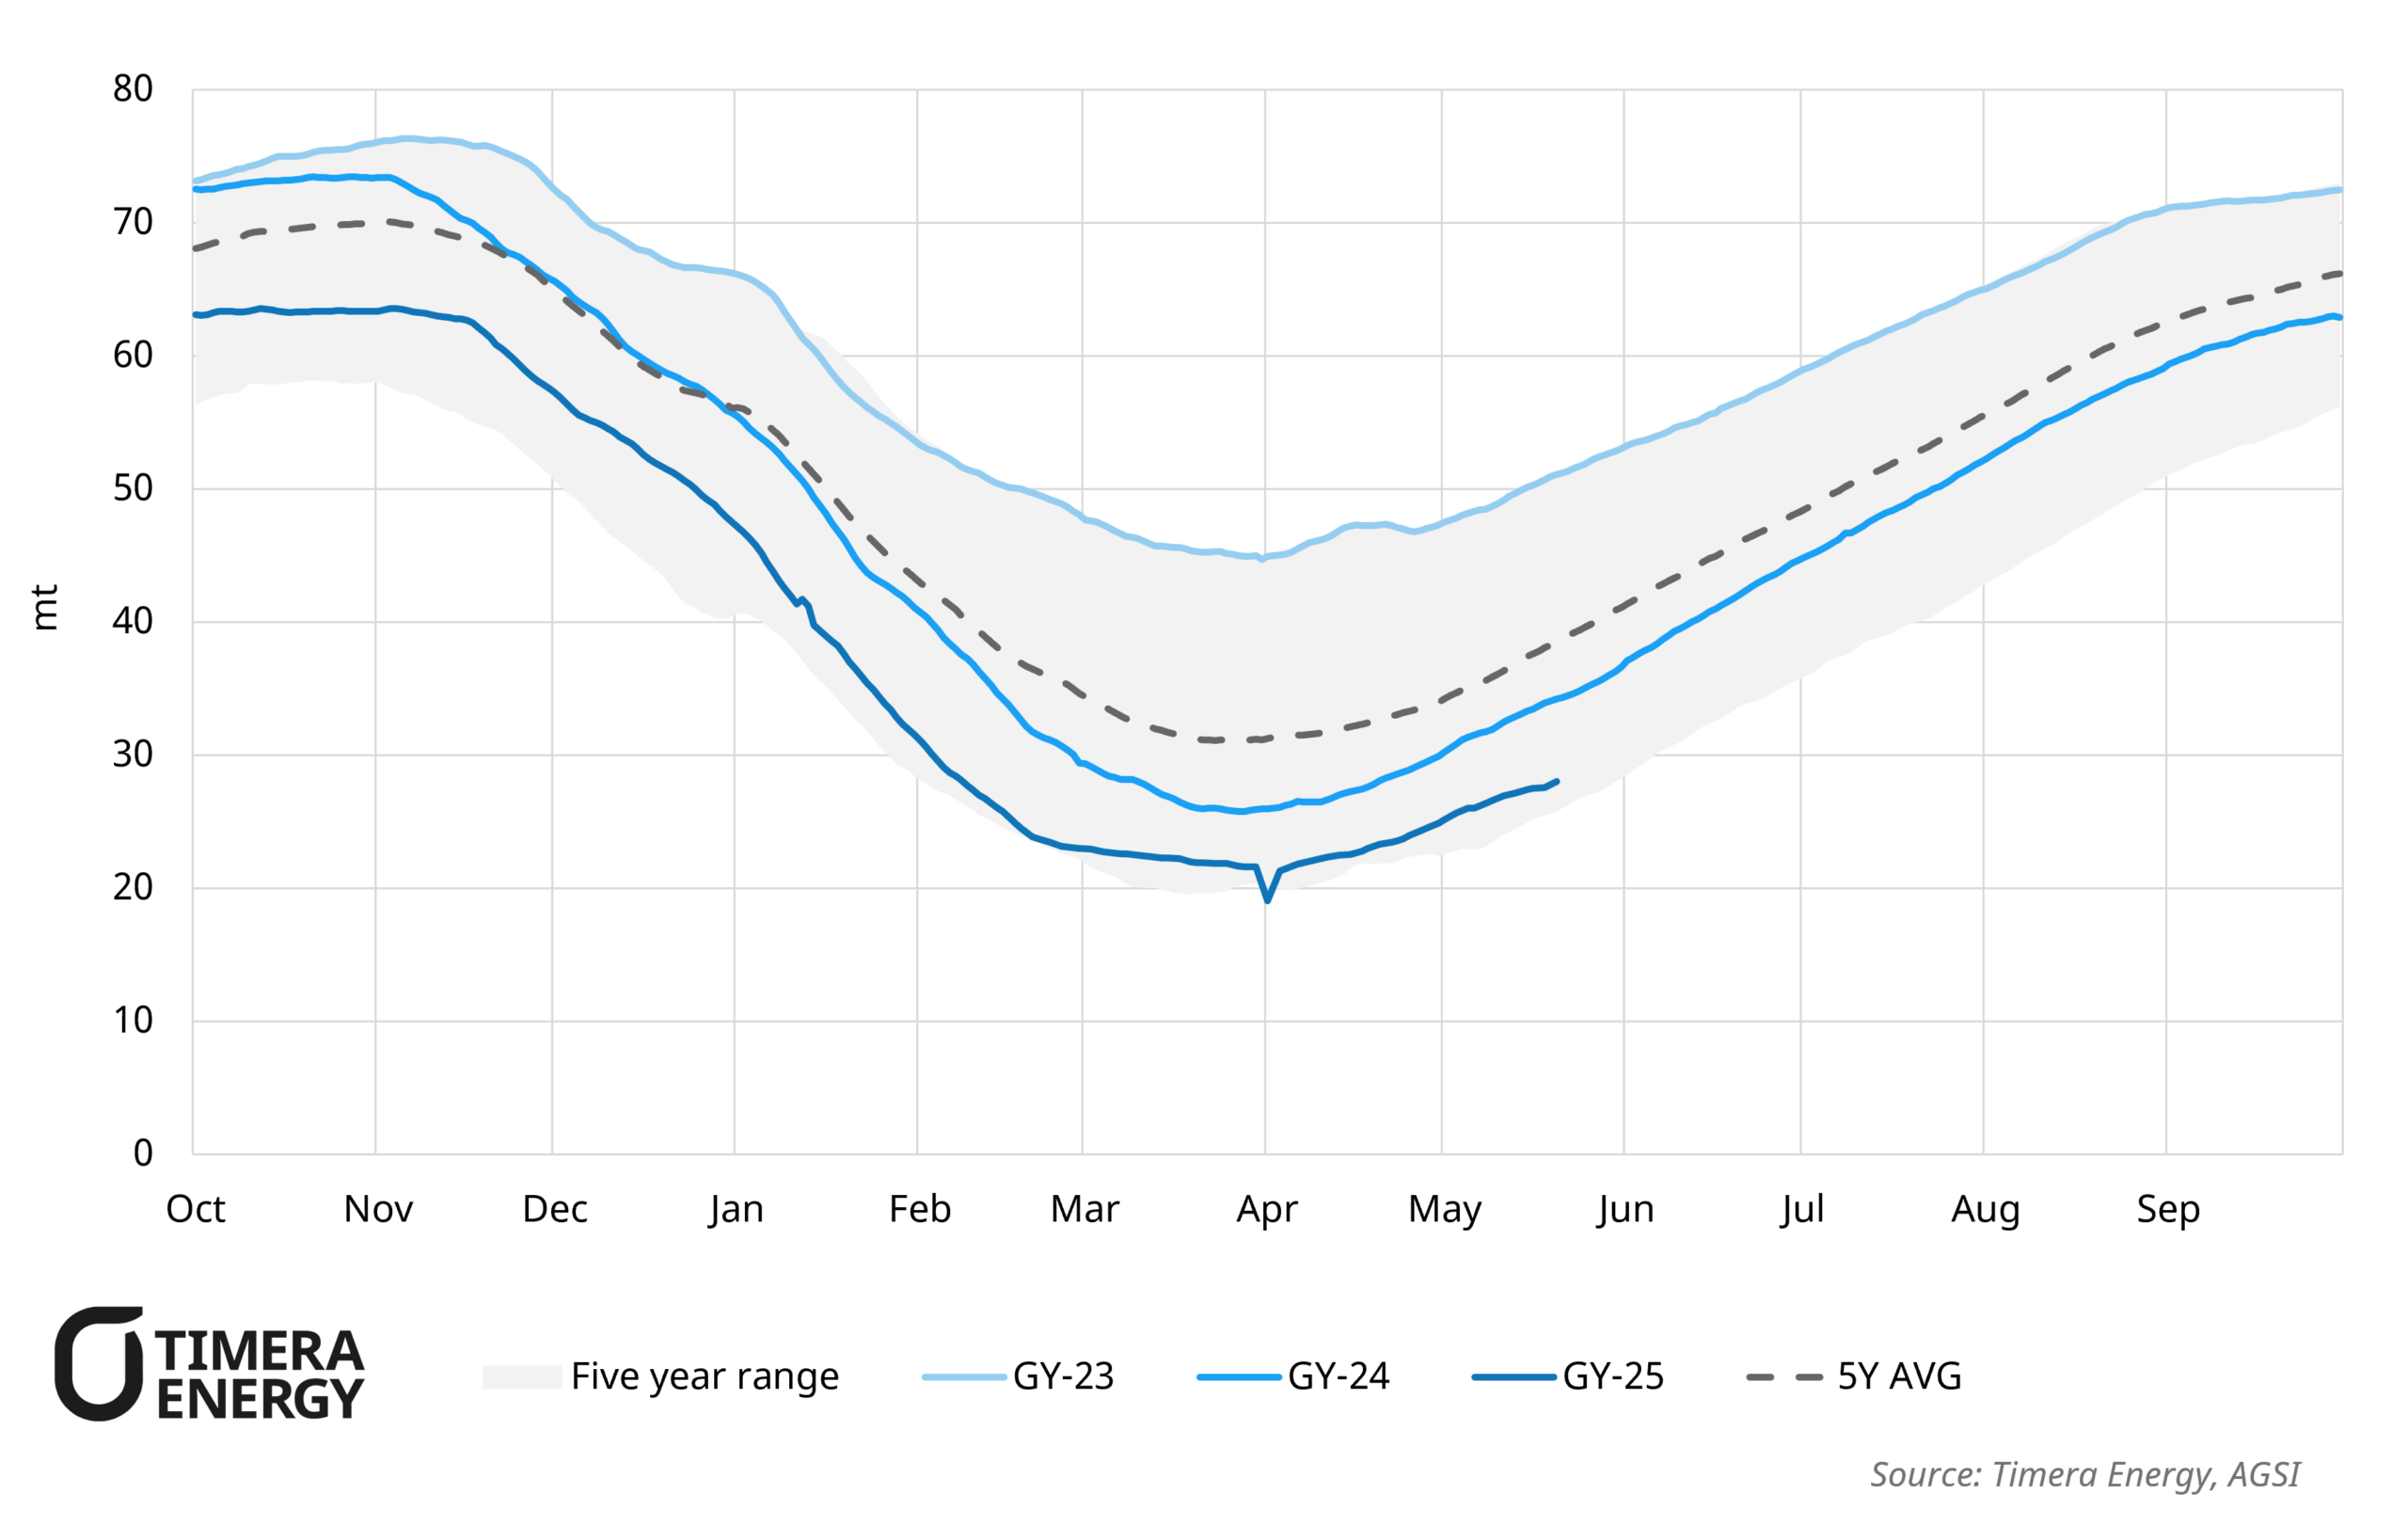
Incremental regasified LNG coming into NWE is expected to support a strengthening of injections into underground storages in Q3. Chart 5 shows aggregate European storage currently sitting well below the five-year range at ~37% (NL 13%, DE 29%).
Chart 5 · European storage vs five-year range
Source: Timera Energy, AGSI
However, even with this incremental LNG, storages face significant challenges in reaching mandated levels. Summer–winter spreads are showing an increasingly steep backwardation, disincentivizing capacity bookings. Governments have shown limited appetite to intervene fiscally and support filling, remaining cautious given the lessons from 2022 when significant losses were incurred on uneconomic injections.
As discussed in a recent snapshot, lower storage fill in Europe will push winter prices higher, improving potential storage value, although strong LNG supply growth winter on winter provides a meaningful offset to lower stock levels year on year.
That said, a failure to provide more certainty on the resumption of Middle Eastern flows within the next few weeks would leave the curve exposed to a sharp re-rating higher and a renewed step-up in volatility, with Europe’s storage trajectory the most exposed pressure point.
For further insight, please contact our LNG & Gas Director David Duncan david.duncan@timera-energy.com.