“Markets don’t clear on perfect foresight… so why do most models assume it?”
Most energy market fundamental models start from the same hidden assumption. They assume that all key variables are known (e.g. demand, weather, input price curves, supply availability and outages).
The model’s job is simply to solve for the equilibrium they produce. Feed in one set of assumptions, and the model returns the single price path that balances the market.
But that’s not how markets work. Producers, consumers, asset operators and traders all make commercial decisions against a range of possible futures, not one assumed known state of the world.
Their strategies price in uncertainty, e.g. the value of flexibility, the cost of being caught wrong, the fact that upside and downside aren’t symmetric. The marginal price that actually clears is the interaction of the aggregate of these uncertainty-weighted decisions. It is never the clean equilibrium a deterministic model solves for.
Forecasting is hard… especially about the future
That’s why forecasts are ‘always wrong’, but not for the reason people assume. It’s not just that assumptions are off.
The problem is a deterministic model resolves every uncertain driver to a single assumed value and solves the equilibrium once, when the market was always going to deliver one draw from a wide distribution of possible outcomes. Being wrong was baked in before a single input was chosen.
At Timera we run our market views through our stochastic global gas model precisely to address this issue. This projects a full distribution of market-clearing outcomes rather than a single equilibrium path.
Let’s take a look at a recent scenario case study that illustrates the point well.
Case study: end-Q1 TTF projection vs Q2 actuals
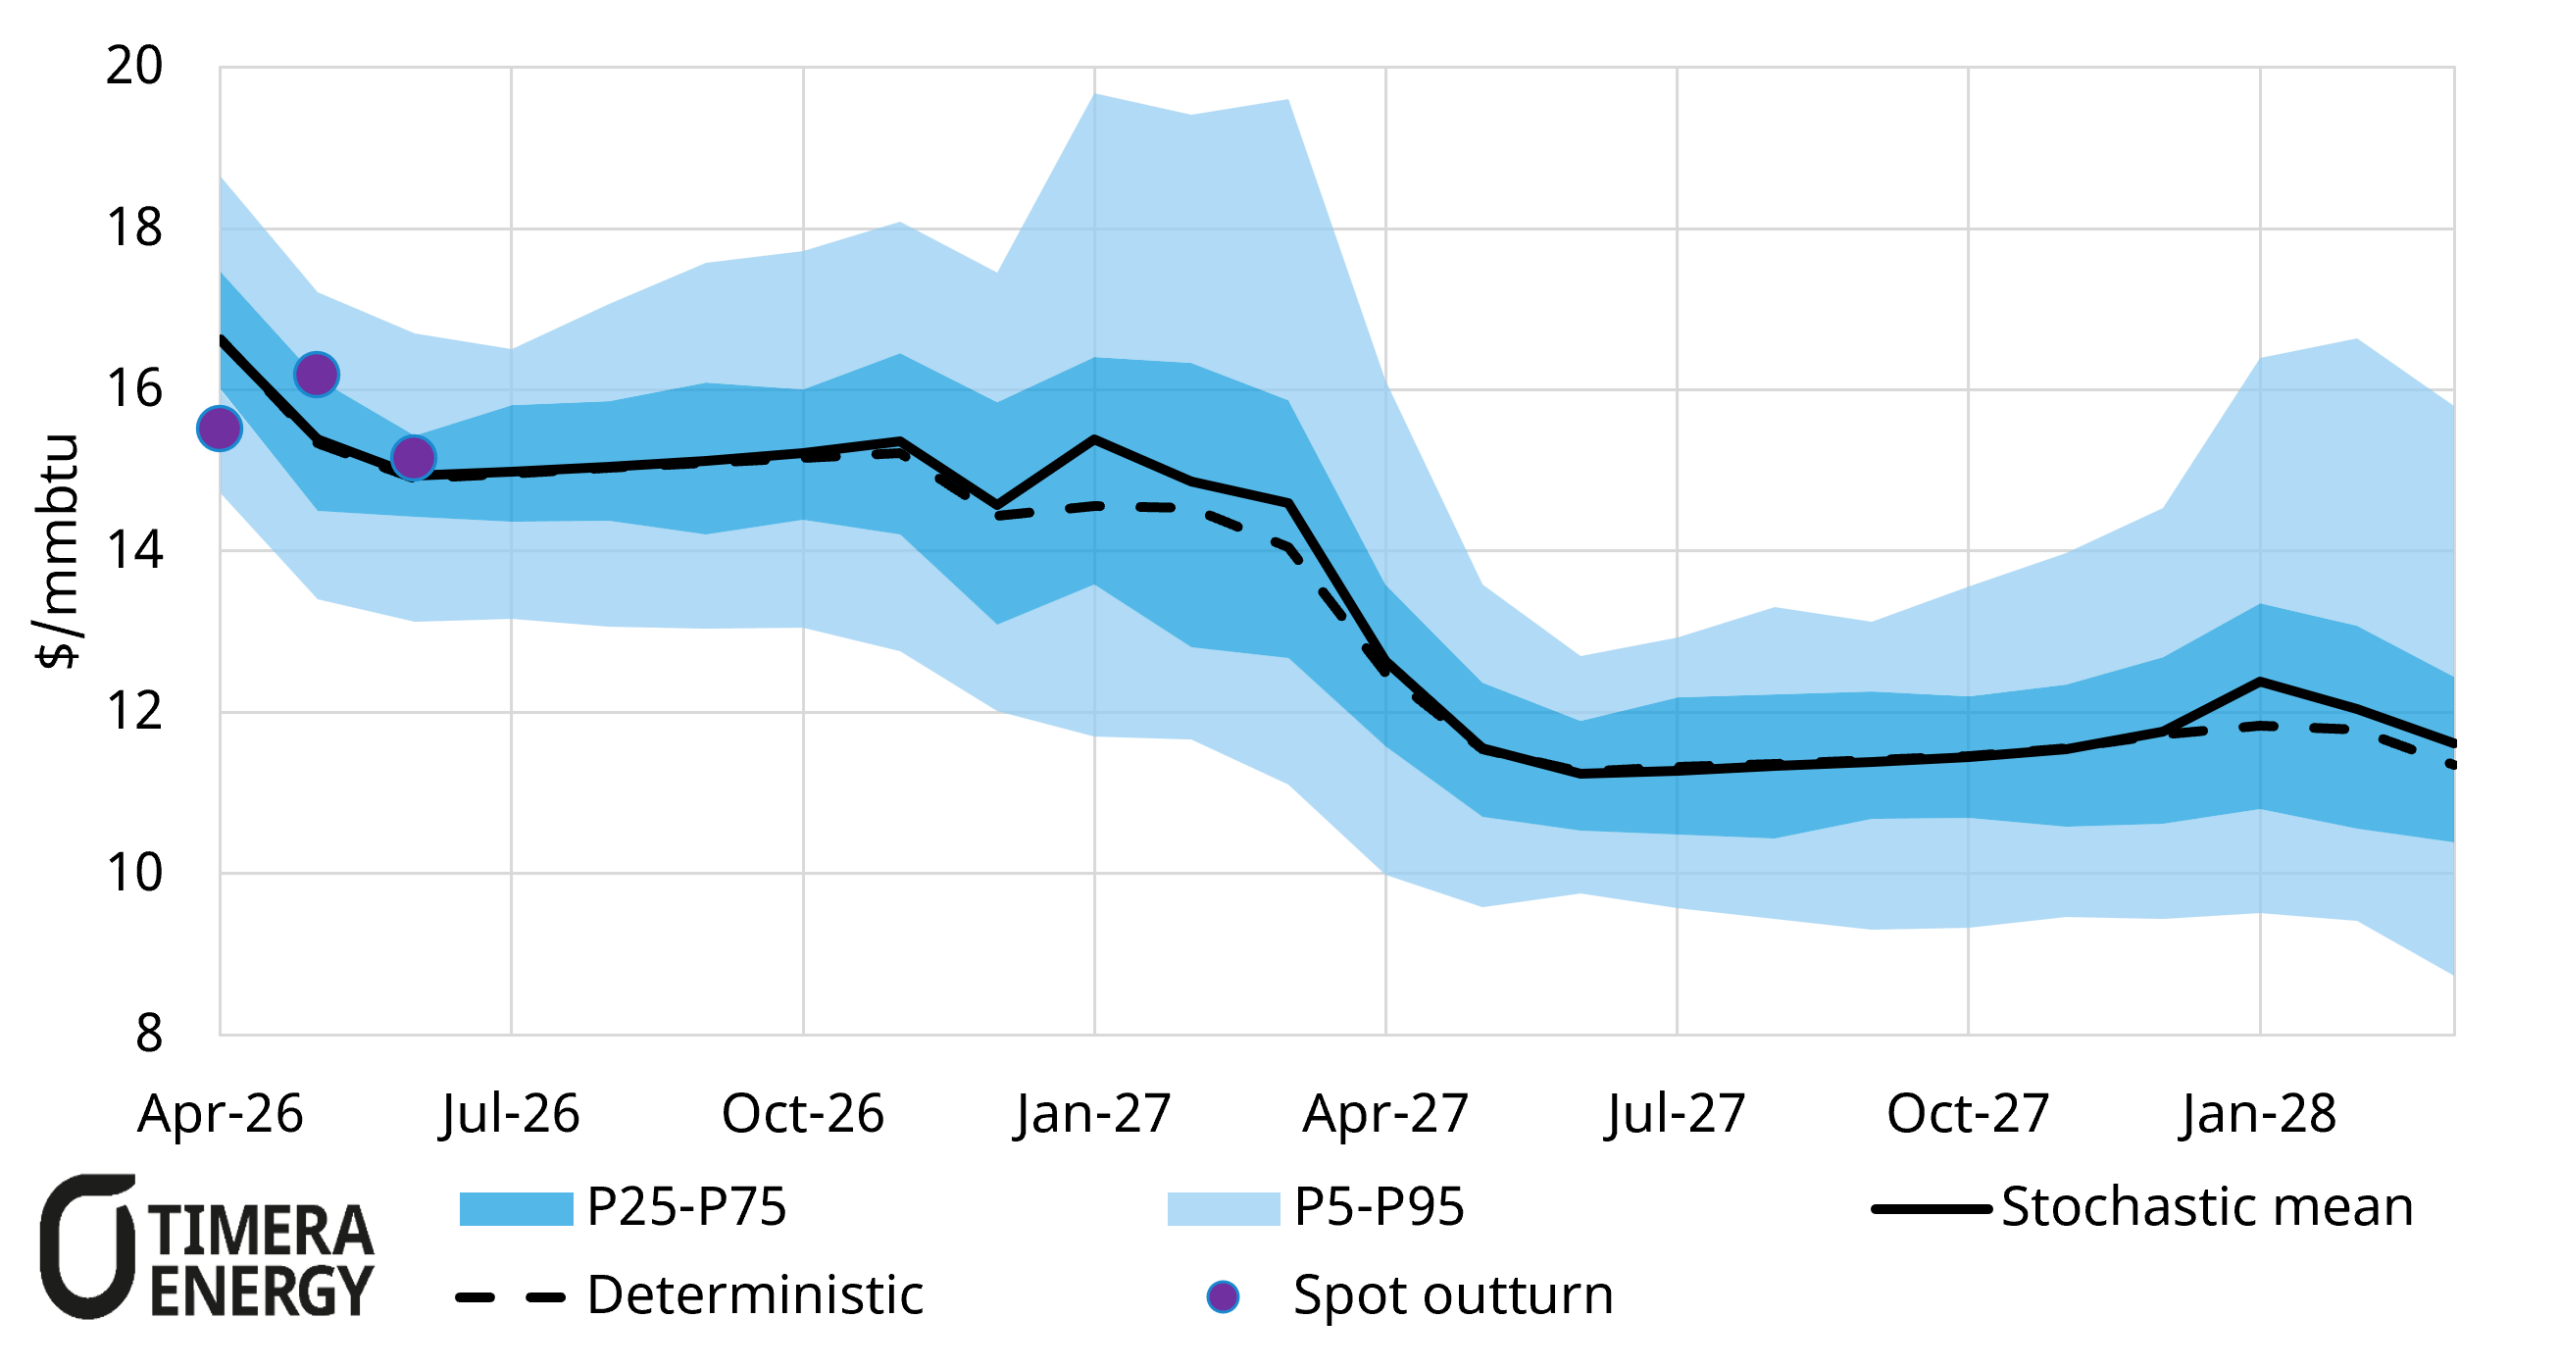
We modelled the TTF price scenario shown in Chart 1 at the end of Q1. We have then overlaid Q2 spot price outturn levels (red dots). Three things stand out.
Chart 2: Deterministic modelling of TTF price vs stochastic mean TTF price output from Timera Gas Market Model
Source: Timera Q1 Quarterly Gas Subscription service (modelled in Timera Global Gas Model)
1. Actuals that look like a ‘miss’ against a point forecast, sit comfortably inside the distribution.
Q2 pricing was buffeted by the ebb and flow of the Middle East supply shock. Traced against the single deterministic line, the resulting outturn prices look like a run of forecasting errors. Traced against the projected distribution, the same outturns sit comfortably within a reasonable range, moving around inside the band rather than breaking out of it.
That’s the whole point: the distribution had already accounted for exactly this kind of supply-side uncertainty, so an outcome that looks like a forecast failure against a point estimate is, against the distribution, simply the market realising one of the paths it always might have. The deterministic view flags an error; the stochastic view shows the market behaving within expectations.
2. A distribution gives a far richer picture of the future than a curve.
The distribution of prices in the top panel reveals what a single deterministic curve cannot. The range of outcomes isn’t constant. It widens materially into each winter and narrows back through summer, across both winters shown.
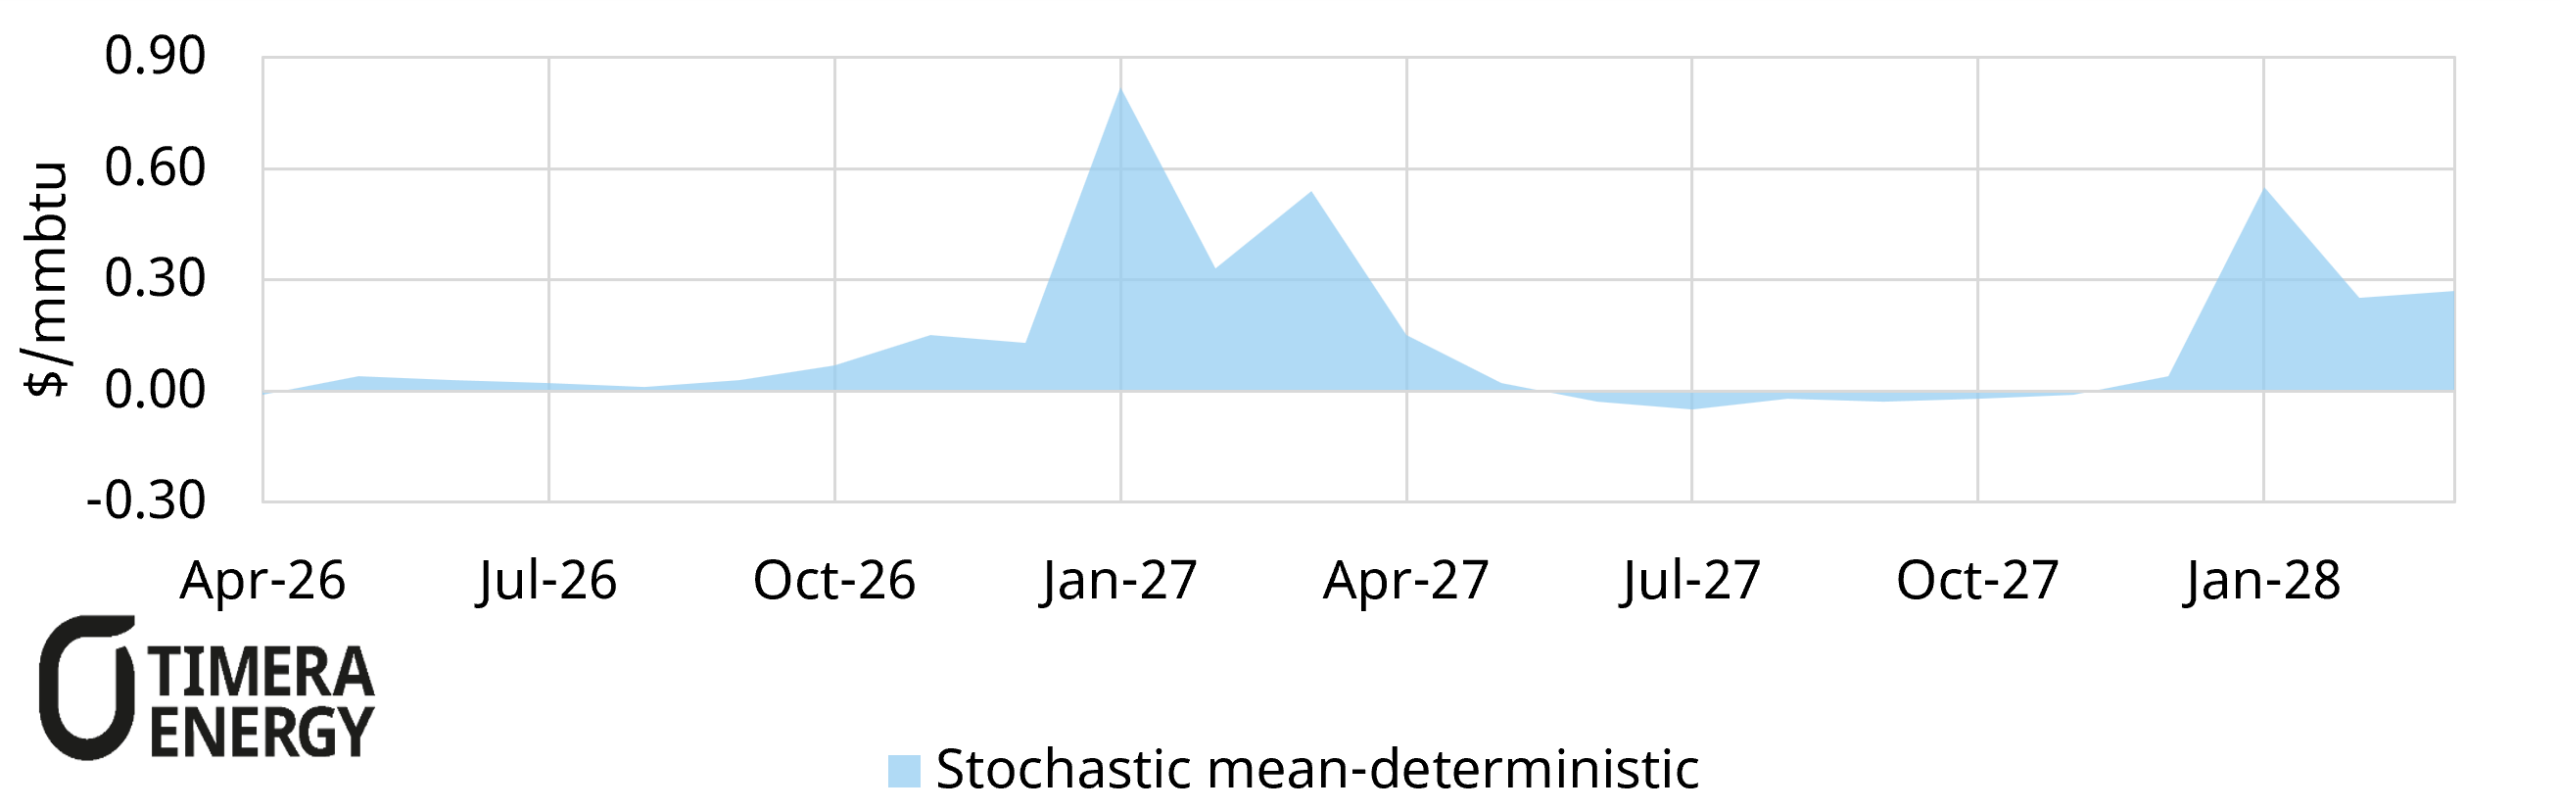
The bottom panel illustrates how energy price distributions are not symmetric. The upside tail stretches further than the downside, so the balance of risk sits above the central case rather than evenly around it. The combination of (i) risk concentrated in winter and (ii) price skew to the upside is an important signal for anyone hedging or valuing winter exposure. None of it is visible on a single line.
3. A single forecast can misprice whole periods, because price formation isn’t linear.
As the market tightens, small changes in the supply-demand balance have an outsized effect on price. Supply and demand become less responsive when the market is stretched, so the same shock that barely moves price in a well-supplied summer can send it sharply higher in a tight winter.
A deterministic model runs one central path and largely misses this. It can’t show how uncertainties compound when the market is stretched, which is exactly when they matter most. The lower panel makes this visible: the gap between the stochastic mean and the deterministic path is small through summer but opens up each winter, as the asymmetric upside from a tight, less-responsive market pulls the mean above the single deterministic line. The result is that a point forecast tends to understate both the value of flexibility and the tail risk in precisely the periods where each is worth the most.
The point isn’t more maths, it’s better decisions.
Stochastic modelling isn’t analytical complexity for its own sake. The aim is the opposite: to produce a more realistic picture of how markets actually behave. Then commercial decisions such as hedging, contracting, asset valuation, investment are made against the real range of outcomes rather than a single path that was never going to happen.
A good forecast shouldn’t just give you a number. It should tell you how confident to be in it, where the risks are skewed, and when the market is most likely to surprise you.
That’s the difference between a forecast that looks precise and one that is genuinely useful.
Our full suite of stochastic market and asset models is built to tackle these issues head on, and underpins the analysis across both our consulting work and our subscription services. If you’d like to discuss how this could support your own commercial decisions, get in touch with our LNG & Gas Director David Duncan (david.duncan@timera-energy.com).