“The Iranian conflict is driving a temporary mini-shock… but there is a much larger structural transition looming”
The global LNG market stands at a pivotal juncture. And it has nothing to do with the Iran / Israel conflict.
With the US escalating conflict in Iran, near term headlines will be dominated by supply risks in the Middle East. But the LNG market faces a much more structural uncertainty as to how demand will respond to balance a surge in new supply.
An unprecedented wave of new liquefaction capacity starts to ramp up over the next year, with over 200 mtpa of new supply set to come online by 2030. The scale of new supply is set to drive a LNG market regime shift and lower prices. And dynamics of this regime will depend on how demand responds to new supply, both:
- The pace of structural demand growth, and
- The price responsiveness of demand to lower prices, particularly in Asia.
In today’s article, we set out a three-scenario framework to help navigate the evolution of the LNG market across the next 5 years and into the 2030s. We also outline the commercial implications of each scenario to support strategic decision-making.
LNG market state of play & Middle East conflict
The LNG market is currently in a structurally tight market regime, ushered in by the surge in European LNG imports in 2021-22 as Russian cuts took effect. Chart 1 summarises pricing dynamics under the current market regime and shows the impact of the recent escalation in Middle East conflict.
Chart 1: TTF & JKM prices vs Brent & switching benchmarks
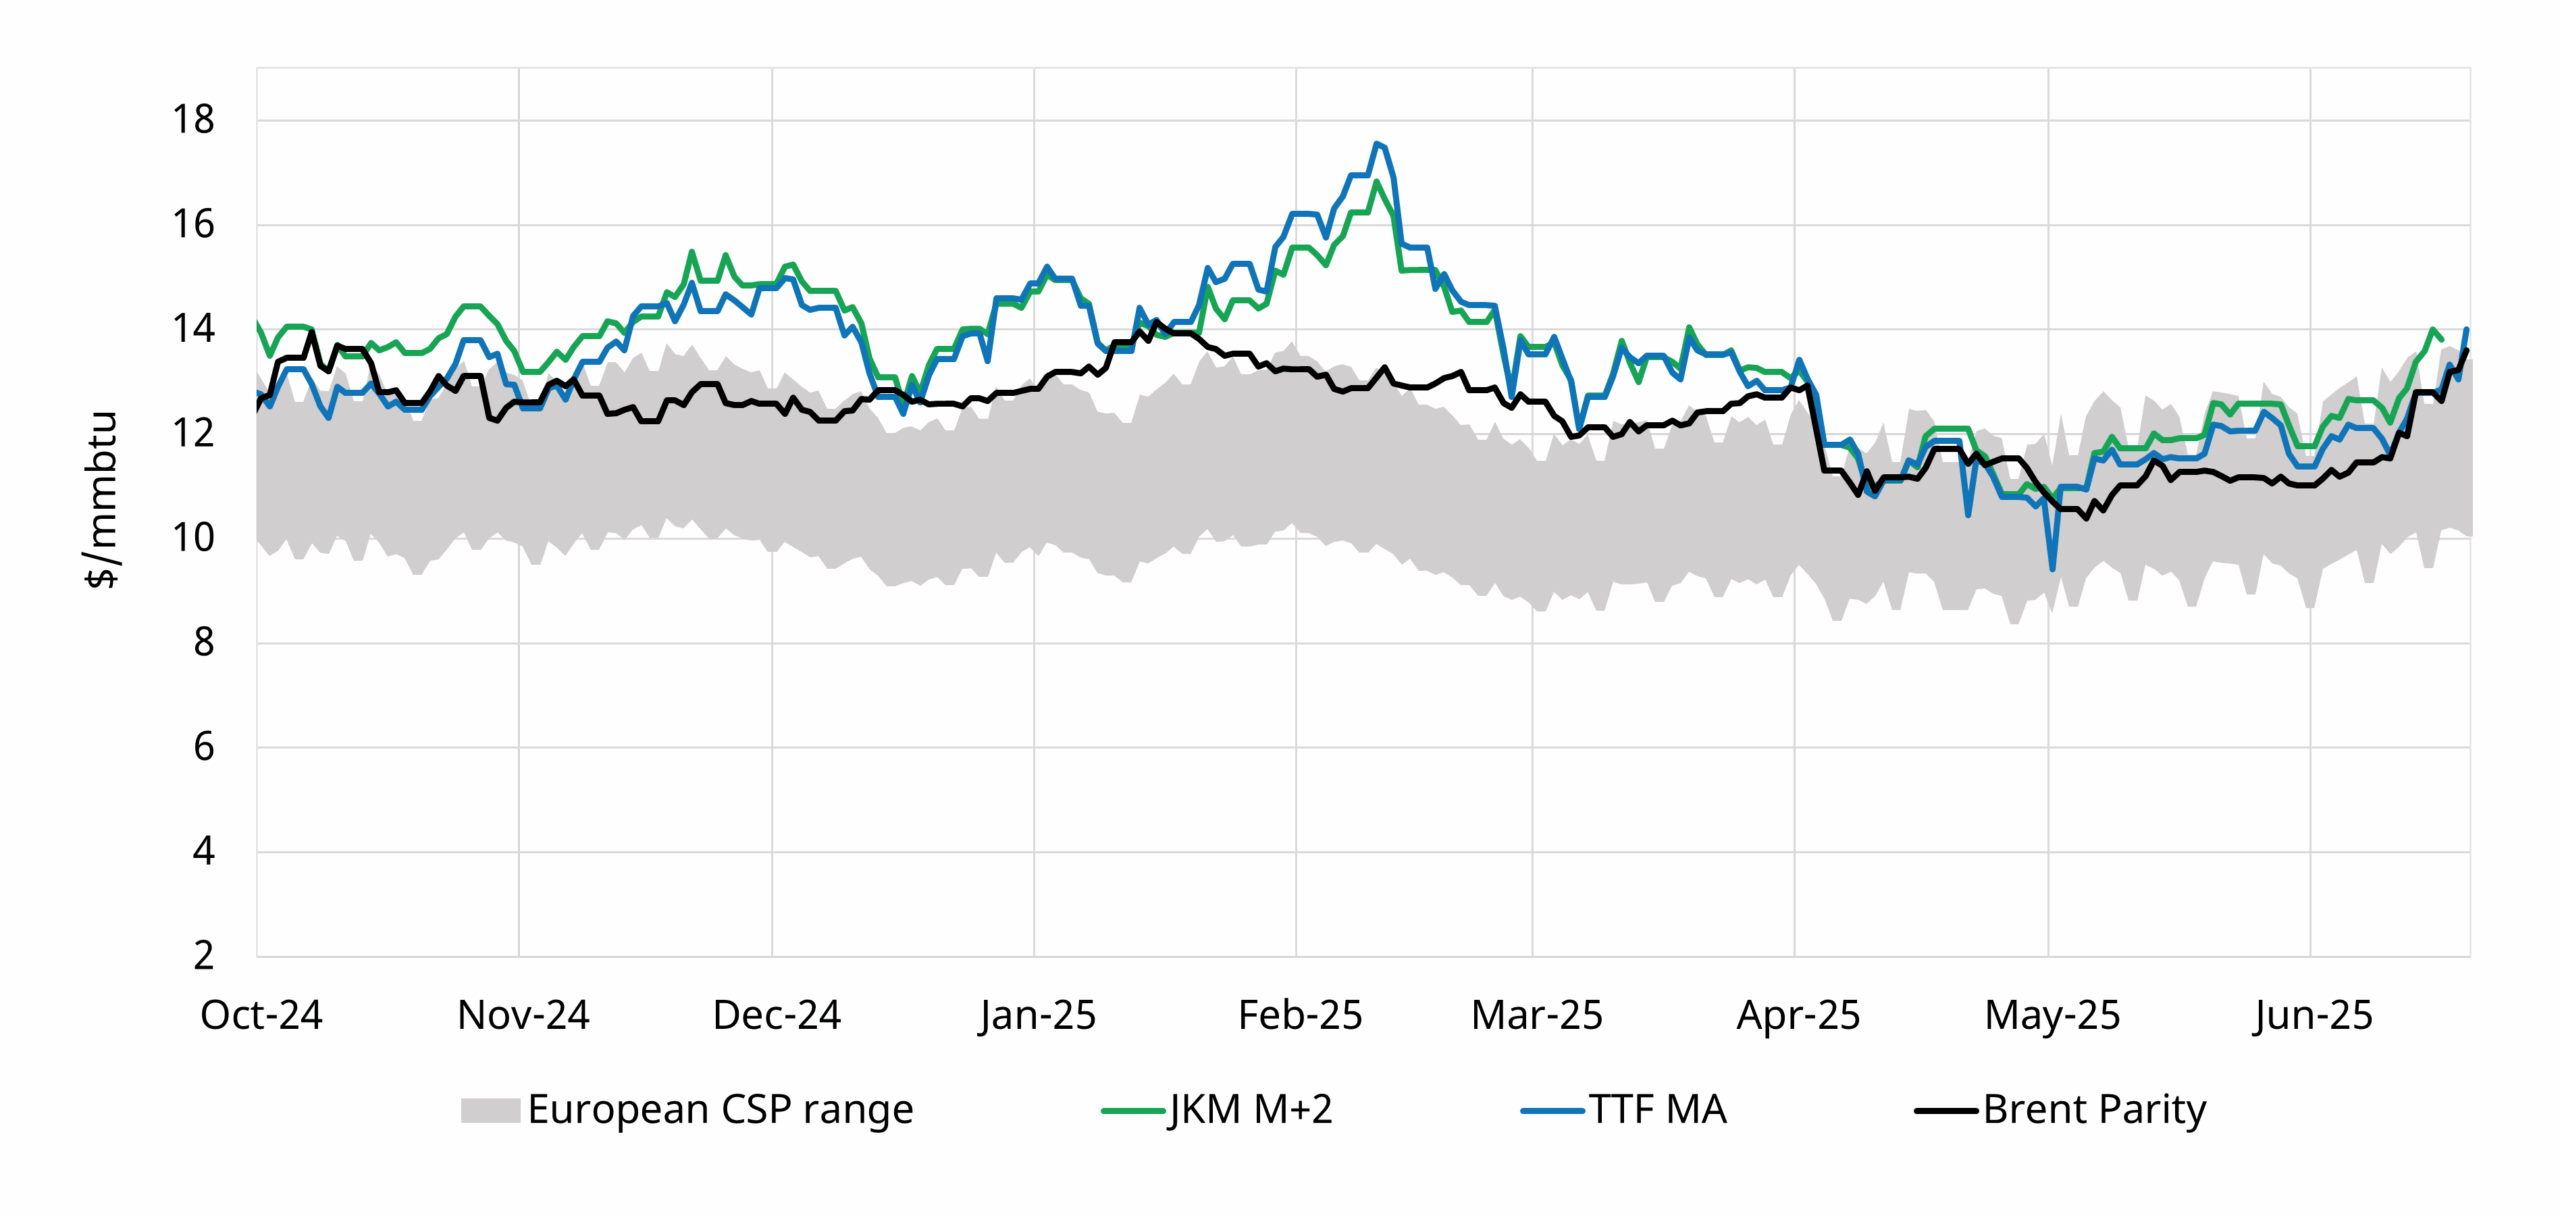
Source: Timera Energy, ICE, CME, Spectron
The chart shows how gas price levels are being consistently supported by:
- Brent price parity e.g. given oil indexed SPA dynamics & Asian substitution (black line)
- European coal for gas switching levels (grey range).
In a LNG market where supply & demand is relatively inelastic at the margin, periods of looser market balance (e.g. Q2 2025 tariff shock) see price support from both Brent parity & European switching. In tighter periods (e.g. Q1 2025 colder winter), JKM & TTF move above these support levels to induce demand response to balance the market (mostly in Asia).
Chart 1 shows how JKM & TTF price rises over the last two weeks of Middle Eastern conflict are being driven predominantly by rising oil prices (& to some extent European switching levels), rather than a tightening LNG market.
Any further escalation may support near term supply risk premiums in the front of crude & gas curves (which are already steeply backwardated). But the knock on impacts are likely to be limited by the simple fact that there is strong global alignment in preventing Iran disrupt the flow of energy out of the Persian Gulf.
Scenario framework to confront LNG market uncertainty
Let’s now consider a more structural change to the LNG market: the looming transition to a new market regime.
A respect for uncertainty is a key ingredient of any analysis of LNG market evolution & it’s commercial impact. We set out below a 3 scenario framework to confront this uncertainty, built on three key drivers:
- Macroeconomic drivers: Economic growth trajectories, structural currency movements (particularly relative USD strength) & commodity price dynamics (e.g. oil & coal)
- Market balance: LNG supply & demand dynamics, particularly the pace and composition of LNG demand growth, but also including the volume profile of new supply.
- Pricing dynamics: How demand & supply elasticity drive pricing at the margin, including Asian demand response, fuel switching dynamics & shut-in economics.
We also consider external stress factors e.g. geopolitical & trade tensions. But the empirical reality of these factors is they are rarely the catalyst for a structural change in market outcomes that is not already reflected in our 3 drivers above.
Exploring the 3 scenarios
We summarise our 3 scenarios in Diagram 1.
Diagram 1: 3 scenario framework for LNG market evolution into 2030s
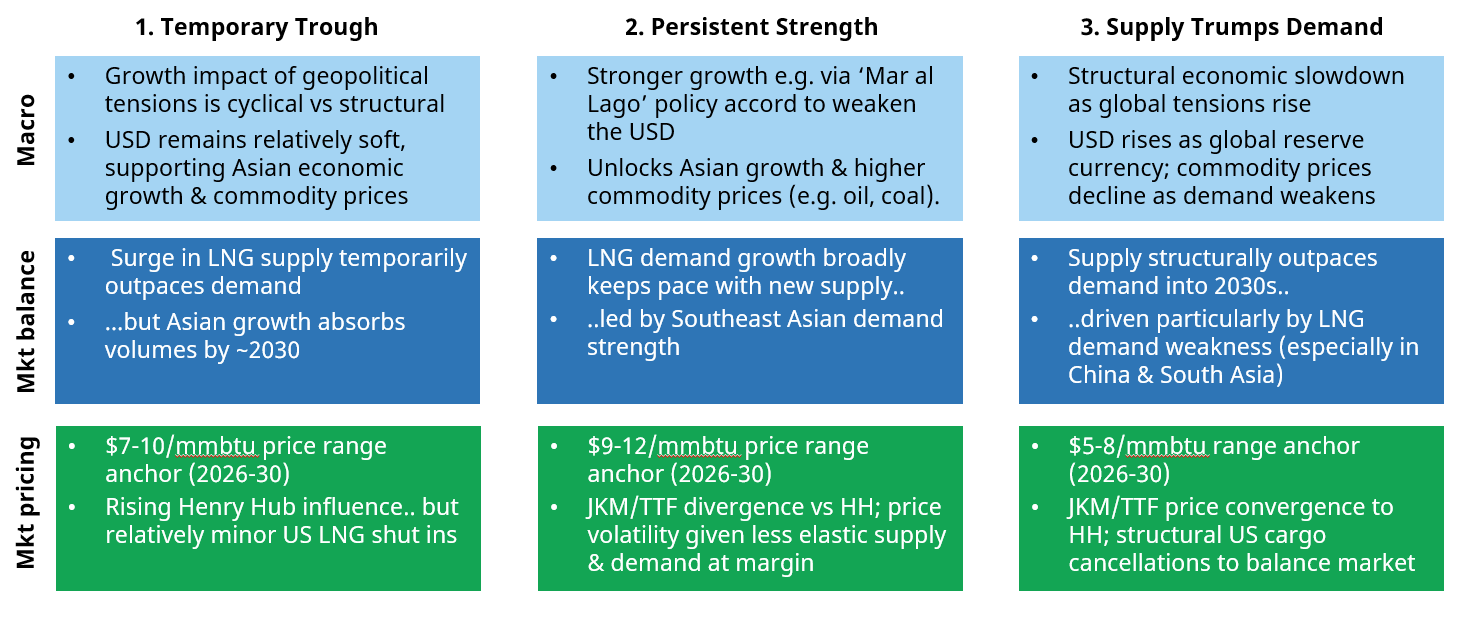
Source: Timera Global Gas Subscription Service
Temporary Trough sees an macro environment that supports structural Asian LNG demand growth to absorb new supply. However prices dip towards Henry Hub support levels across the next 5 years (7-10 $/mmbtu annual average price range), to induce adequate demand response to clear the market.
Persistent Strength is defined by a macro regime shift where a weaker USD enables renewed fiscal stimulus in Asia & Europe, supporting global commodity prices. Gas prices (9-12 $/mmbtu annual average range) are supported by robust demand growth (particularly in Asia) & competitiveness of gas vs higher coal & oil prices.
Supply Trumps Demand is characterised by a weaker economic backdrop and growing geopolitical tensions. Supply structurally outpaces demand into the early 2030s, with ‘lower for longer’ price levels (5-8 $/mmbtu annual average range) & significant US shut ins required to balance a LNG market competing against cheaper oil & coal.
Supply & Demand curve dynamics drive market outcomes
It is one thing mapping out scenario pathways. It is another to turn these into robust quantitative insights on market evolution & commercial implications.
Timera’s global S&D curve framework is ideally suited to analyse the impact of a range of potential market outcomes. Scenario analysis in our global gas market model yields key insights on evolution of:
- Market S&D balance
- Pricing dynamics (e.g. levels, spreads, volatility)
- Commercial implications for asset / portfolio value & risk
In Chart 2 we show a simplified illustrative view of the dynamics in play across the 3 scenarios. The chart shows demand curve shifts only – in reality these interact with supply curve shifts in the model.
The full supply & demand curve & pricing dynamic analysis is available in our quarterly Global Gas Subscription Service which we will release later this month.
Chart 2: Global LNG supply vs demand curve shifts in 2029
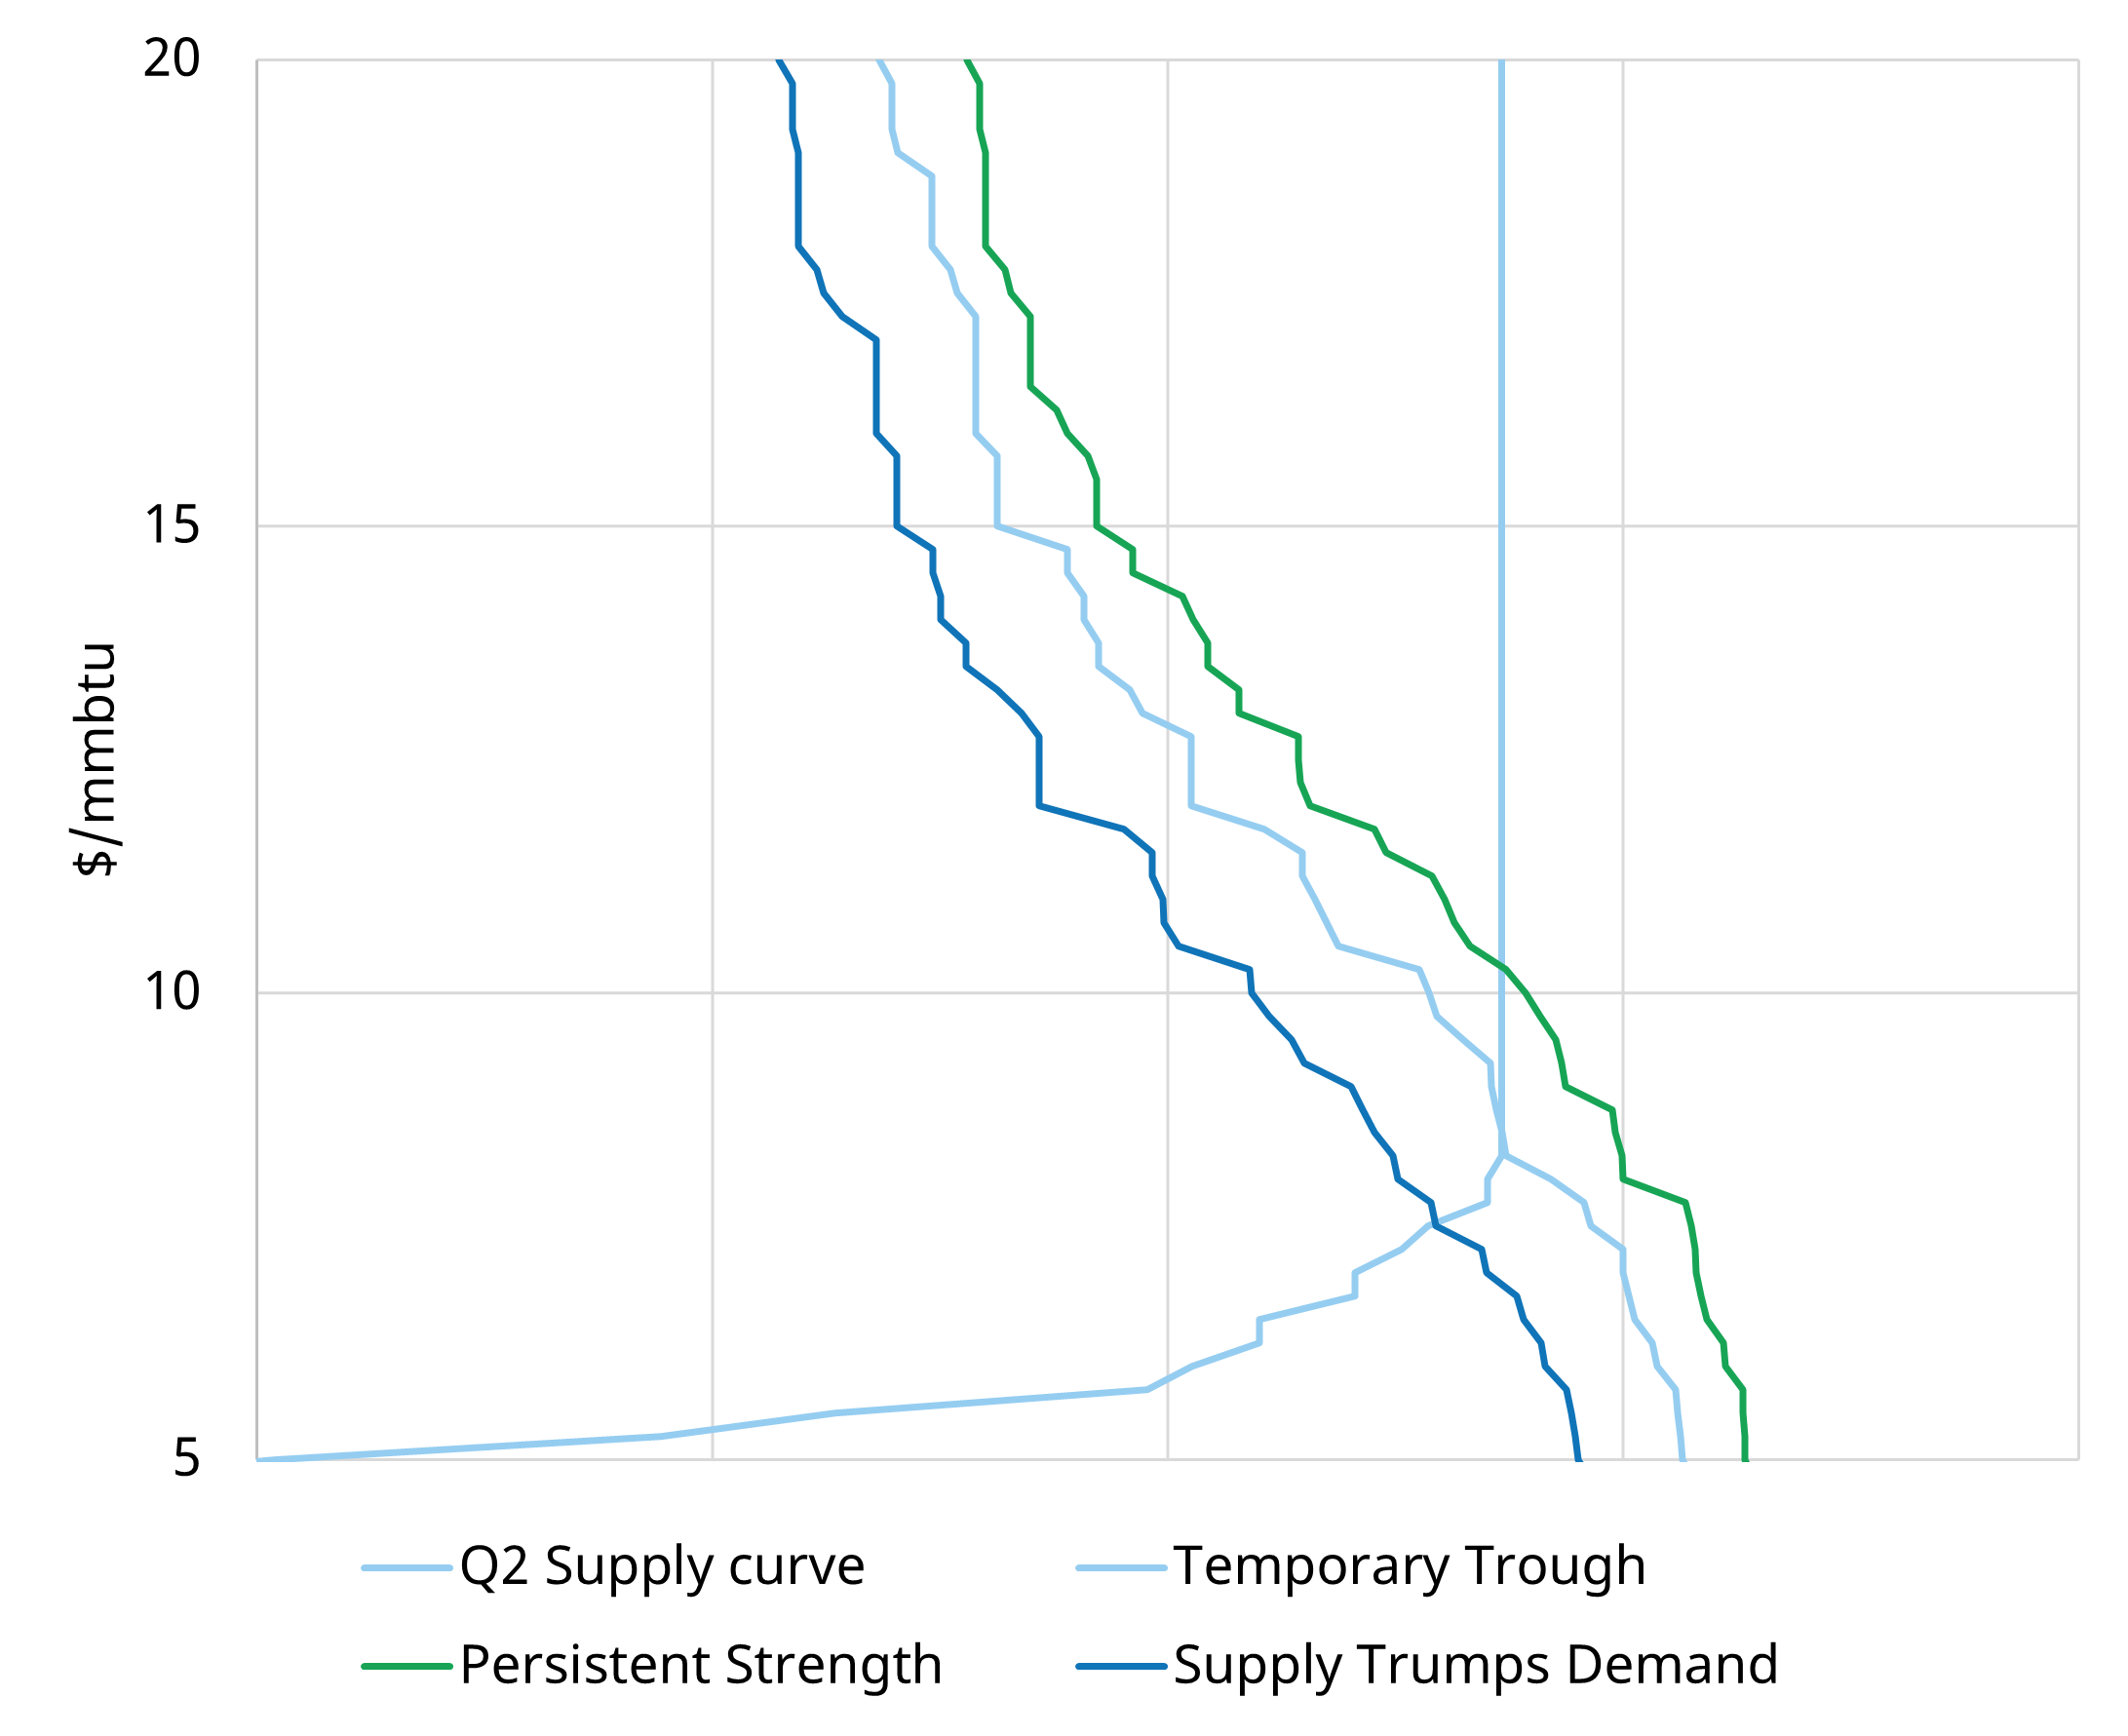
Source: Timera Global Gas Model
The chart is anchored around the Temporary Trough scenario LNG market supply & demand balance for 2029 (light blue lines).
In the Persistent Strength scenario, higher commodity prices move the demand curve up, while stronger demand growth & response move the demand curve to the right. Under this scenario relatively inelastic supply & demand drive higher & more volatile prices.
Under the Supply Trumps Demand scenario, the global demand curve shifts down & to the left, with prices declining into more price responsive US cargo cancellation ranges.
Commercial implications of each scenario
We summarise a set of commercial considerations for each of the 3 scenarios in Table 1.
Table 1: Scenario commercial considerations
We have found this 3 scenario framework very useful for quantifying market outcomes and their impact on LNG & gas portfolio value & risk.
Navigating the transition to a new regime is not about ‘forecasting’ the right outcome. It is about confronting market uncertainty and having a portfolio value capture & risk management plan that is robust for a range of potential outcomes.
Our full analysis of these 3 scenarios and commercial impact on asset & portfolio value is included in our latest Global Gas Subscription Service. Feel free to reach out to David Duncan (LNG & Gas Director david.duncan@timera-energy.com ) for details and a free sample copy of the report.
Join our webinar “Gas markets in flux: a framework for confronting macro uncertainty”
Topic: Navigating gas market uncertainty, unpacking macroeconomic drivers, detailed scenario analysis, and the evolving impact of uncertain demand on market dynamics and price formation.
Time & access: Wed 2nd July 10:00-10:30 CET (09:00-09:30 BST)
Registration: Pre-registration required (access is free); webinar registration link – register here
Coverage:
- Macro drivers of gas market uncertainty as new supply wave looms
- 3 scenario framework to navigate LNG & gas market evolution
- Supply & demand curve framework sheds light on pricing dynamics
- Why demand is key to shaping market evolution & price formation
- Commercial & value implications of different market paths