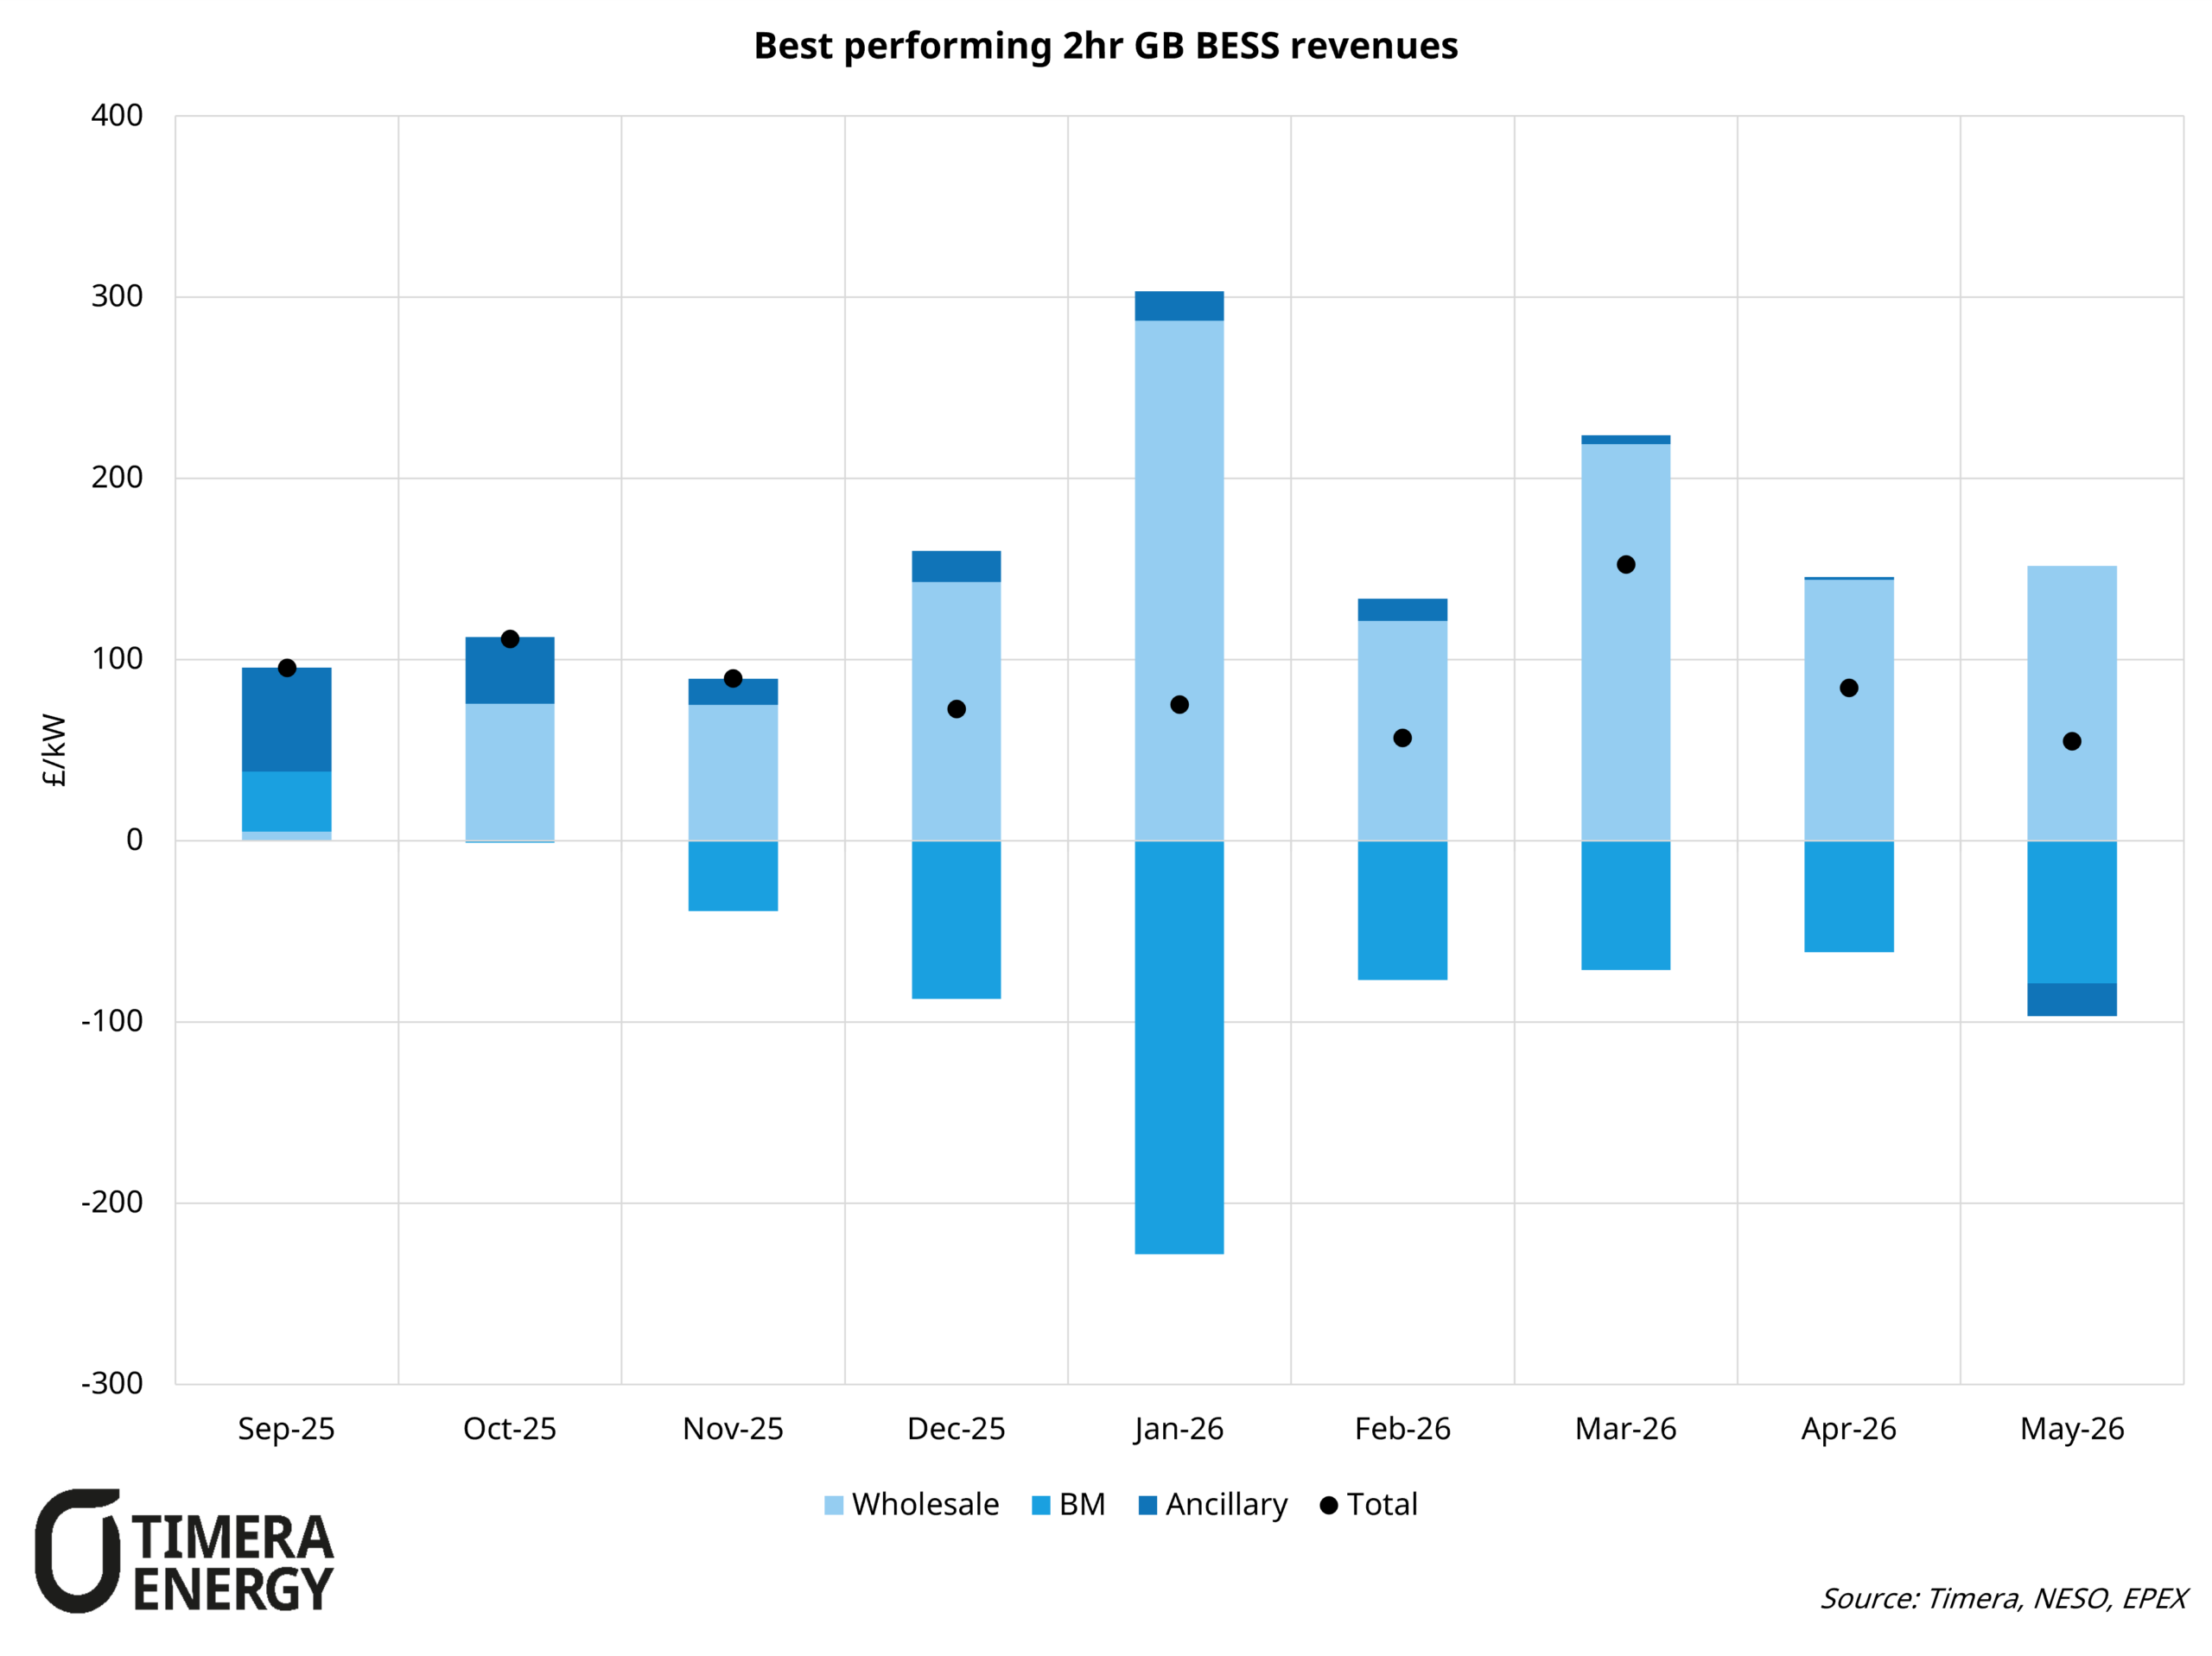
Chart: Top performing GB BESS revenues (2hr) Note: Not accounting for grid fees, availability, imbalance, penalties or intraday re-optimisation value
The chart above shows the revenue profiles of the top performing BESS across September 2025 – May 2026. Into May 2026 2hr revenues have fallen from 100 £/kW + in March-26, 80-90 £/kW in April down to 45-55 £/kW in May-26. 1hr Spreads fell from ~80 £/MWh in March/April down to ~50 £/MWh in May. This has been driven by a few factors:
1. A drop in wind levels into May 2026 from ~6TWh in March and April respectively down to ~4.5 TWh in May. This has acted to reduce the uplift for Northern Scottish assets which benefit from congestion behind the B4 and B6 boundaries, as well as reducing volatility in power prices and spreads.
2. A ~17% decline in gas prices relative to April has weighed on power price spreads, reversing some of the rally seen at the start of the Iran war, although gas prices remain elevated compared with pre-conflict levels.
3. Low demand across the month with a new minimum National Demand (Total demand net of embedded generation) set on May 24th reducing volatility & scarcity on the system.
4. A fall in ancillary prices, particularly DRH, from ~3 £/MW/h in September-25 to ~-10 £/MW/h in May-26 reflecting increasing activation of upward reserve during low demand periods increasing the value of the service for BESS to charge at a discount to wholesale price, as well as growing competition in the service as BESS capacity grows. The launch of Slow reserve has had a lower impact vs Quick reserve given longer response times reducing the suitability for BESS participation.
Understanding recent BESS performance is useful to get a view of current state of play, however, revenue charts & indices such as these do not provide a complete picture of BESS project performance. A comprehensive assessment must also consider factors such as TNUoS, embedded benefits, performance penalties, and trading strategy. Some revenue streams may prove transitional as market rules evolve, potentially reducing their long-term viability over an investment horizon.
In a forthcoming article, we will take a deeper dive into GB BESS performance and market outlooks, as well as compare investment opportunities and operational dynamics across other European storage markets.
Coming soon: Timera’s Q2-26 GB BESS revenue curves.
Our latest quarterly update will provide an updated outlook for GB battery storage revenues, alongside detailed analysis of evolving market fundamentals and key value drivers.
Timera is active across the GB BESS market, supporting transactions and providing a quarterly subscription service featuring revenue curves and in-depth market research.
To discuss our Q2-26 views or learn more about our services, contact Arshpreet Dhatt at arshpreet.dhatt@timera-energy.com.