On 1st Jan 2024, shipping activities within the European Union came under the EU-ETS carbon scheme. This means vessels operating within Europe will bear the cost of purchasing EUA carbon certificates, increasing variable shipping costs.
The scheme is being phased in over the next 3 years with the charging burden for vessel owners being increased as follows:
- 2024: 40% of emissions cost
- 2025: 70% of emissions cost
- 2026: 100% of emissions cost.
The regulation covers all ships over 5,000 (gross tonnage) GT in size travelling within Europe.
The scheme applies for 100% of emissions for voyages starting and ending within Europe (e.g. Hammerfest to Gate) and 50% of emissions for voyages to or from Europe (e.g. Sabine Pass to GATE). The scheme applies for both for laden and ballast legs.
The impact of the scheme is much broader than just the cost impact on individual vessels. It is set to influence global prices spreads and cargo flows. We explore the impact in today’s article.
Scheme cost implications
The impact of the scheme on vessels is not ‘one size fits all’ – it will vary across time & vessel types. Additional costs incurred depend on:
- EUA price
- Carbon emissions of propulsion fuel
- Fuel used (e.g. fuel oil, diesel or boil off)
- Vessel capacity & speed
- Voyage distance & routing (laden & ballast legs).
Let’s look at a simple case study to illustrate the scale of cost impact in Chart 1. The case study covers incremental cost impact in $/mmbtu:
- a 3.6 tbtu LNG cargo
- using current EUA carbon curve
- assuming 0.15%/d boil off (all for propulsion) & no additional fuel oil requirement
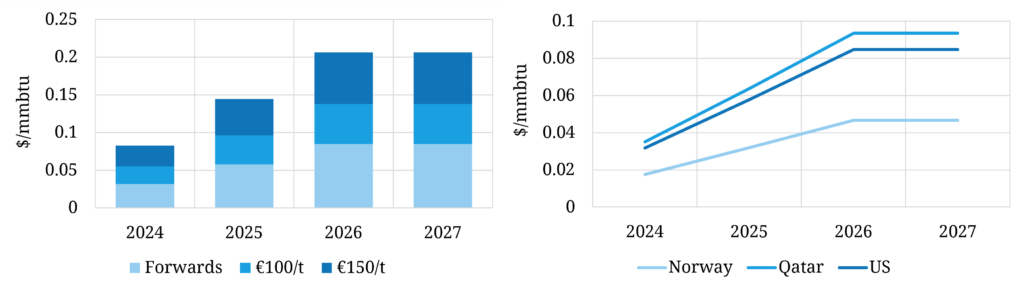
Chart 1: Shipping cost impact case study by vessel journey
The left hand panel of the chart shows the incremental shipping cost impact for a voyage from US Gulf Coast to the GATE terminal in the Netherlands at current EUA prices (~56 €/t) vs 100 & 150 €/t.
The right hand panel shows the impact of relative voyage distance via 3 examples: US Gulf Coast, Qatar & Norway. It goes without saying that the longer the voyage the higher the cost impact.
LNG market impact
The incremental cost numbers above may not seem huge relative to the all-in price of LNG, but they can have a material impact on LNG market price spreads and cargo flows.
On the margin, the increase in cost of shipping LNG to Europe should increase European LNG prices vs other destinations (e.g. Asia) to incentivise the flows to Europe required to meet demand. The price impact will differ based on the source of the marginal cargo.
There may also be a marginal second order impact of reducing European demand for gas given higher prices.
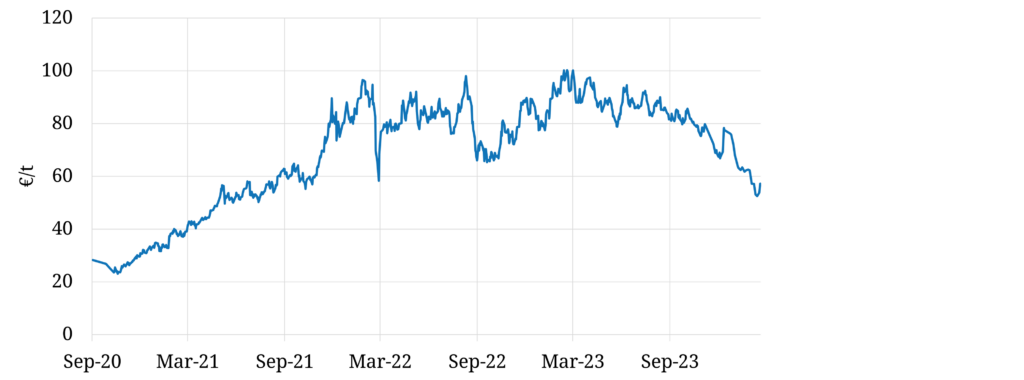
It is also worth noting the volatility of carbon EUA prices across the last few years as shown in Chart 2.
Chart 2: Evolution of carbon EUA prices across last 4 years
Chart 1 provides an indication of how much the cost & price impact can change given volatility in carbon price.
LNG portfolio optimisation impact
The most important impact of these marginal changes is on LNG portfolio optimisation & value capture. Even relatively small changes in shipping costs & cross basin spreads can have a substantial impact on cargo routing & margins.
We summarise some of the more important impacts on LNG portfolio management in Table 1.
Table 1: Portfolio management impacts of EU ETS extension to LNG shipping
As a barometer of LNG market impact, we have seen a significant recent increase in client focus on impact of the scheme across the last few months. LNG commercial functions are trying to work out the optimisation, logistics & value impacts as well as investing in associated systems & processes to deal with this. In line with this, we are currently enhancing EUA shipping cost functionality in our LNG Bridge portfolio model.
It is important to note that the portfolio impact of the scheme depends on market regime & pricing dynamics. In a tight market (e.g. 2021-22), the incremental costs are small relative to large & volatile cargo margins. But in an oversupplied market (e.g. 2020), thin margins mean that every cent matters and there is a strong focus on optimising costs.
As LNG supply and market competition increases this decade, value capture at the margin underpins competitive edge.
Join our LNG webinar “Focus on flex”
Topic: “Focus on flex” – how changing market dynamics are shifting LNG contract flex value
Time & access: Thurs 18th Apr 09:00 BST (10:00 CET, 16:00 SGT)
Registration: Pre-registration required (access is free); webinar registration link – register here
Scope:
- How global supply & demand shifts are driving the recent fall in gas & LNG prices
- Impact of the changing conditions on LNG contract flexibility value
- Drivers of contract flex value, including intrinsic vs extrinsic value
- Demonstrating how flex value is shifting via (i) US contract case study (ii) Brent indexed Asia DES sale
Any Qs please contact david.duncan@timera-energy.com