Featured
January 13, 2014

Steam coming out of the LNG shipping market

1 min

Subscribe to our blog

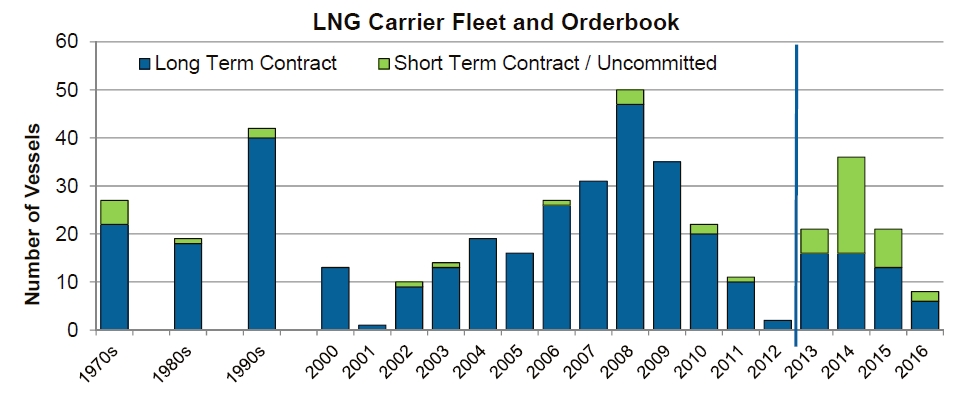
With rapid growth in the trading of spot and short term LNG cargoes, fluctuations in spot shipping charter rates are having an increasingly important impact on the pricing and flow of LNG.  The LNG shipping market has evolved rapidly over the last decade, driven by growth in global liquefaction capacity.  But the order and delivery of LNG vessels has been quite cyclical in nature.

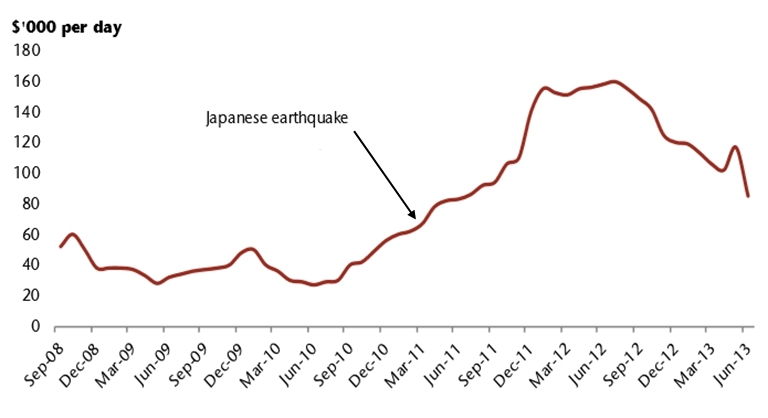
Shipping charter rates are the largest component of the cost of moving LNG around the globe.  Break even charter rates are estimated to be around 60,000 $/day.  But recent years have seen some wild swings in spot charter rates above and below this level.

Charter rates fell as low as 25,000 $/day at the depth of the financial crisis before recovering to 160,000 $/day post-Fukushima.  Spot charter rates are currently around 90,000 $/day, but a surge in delivery of new vessels in 2013 and 2014 could again tip the LNG shipping market into a period of oversupply.

LNG shipping – the basics

The fleet

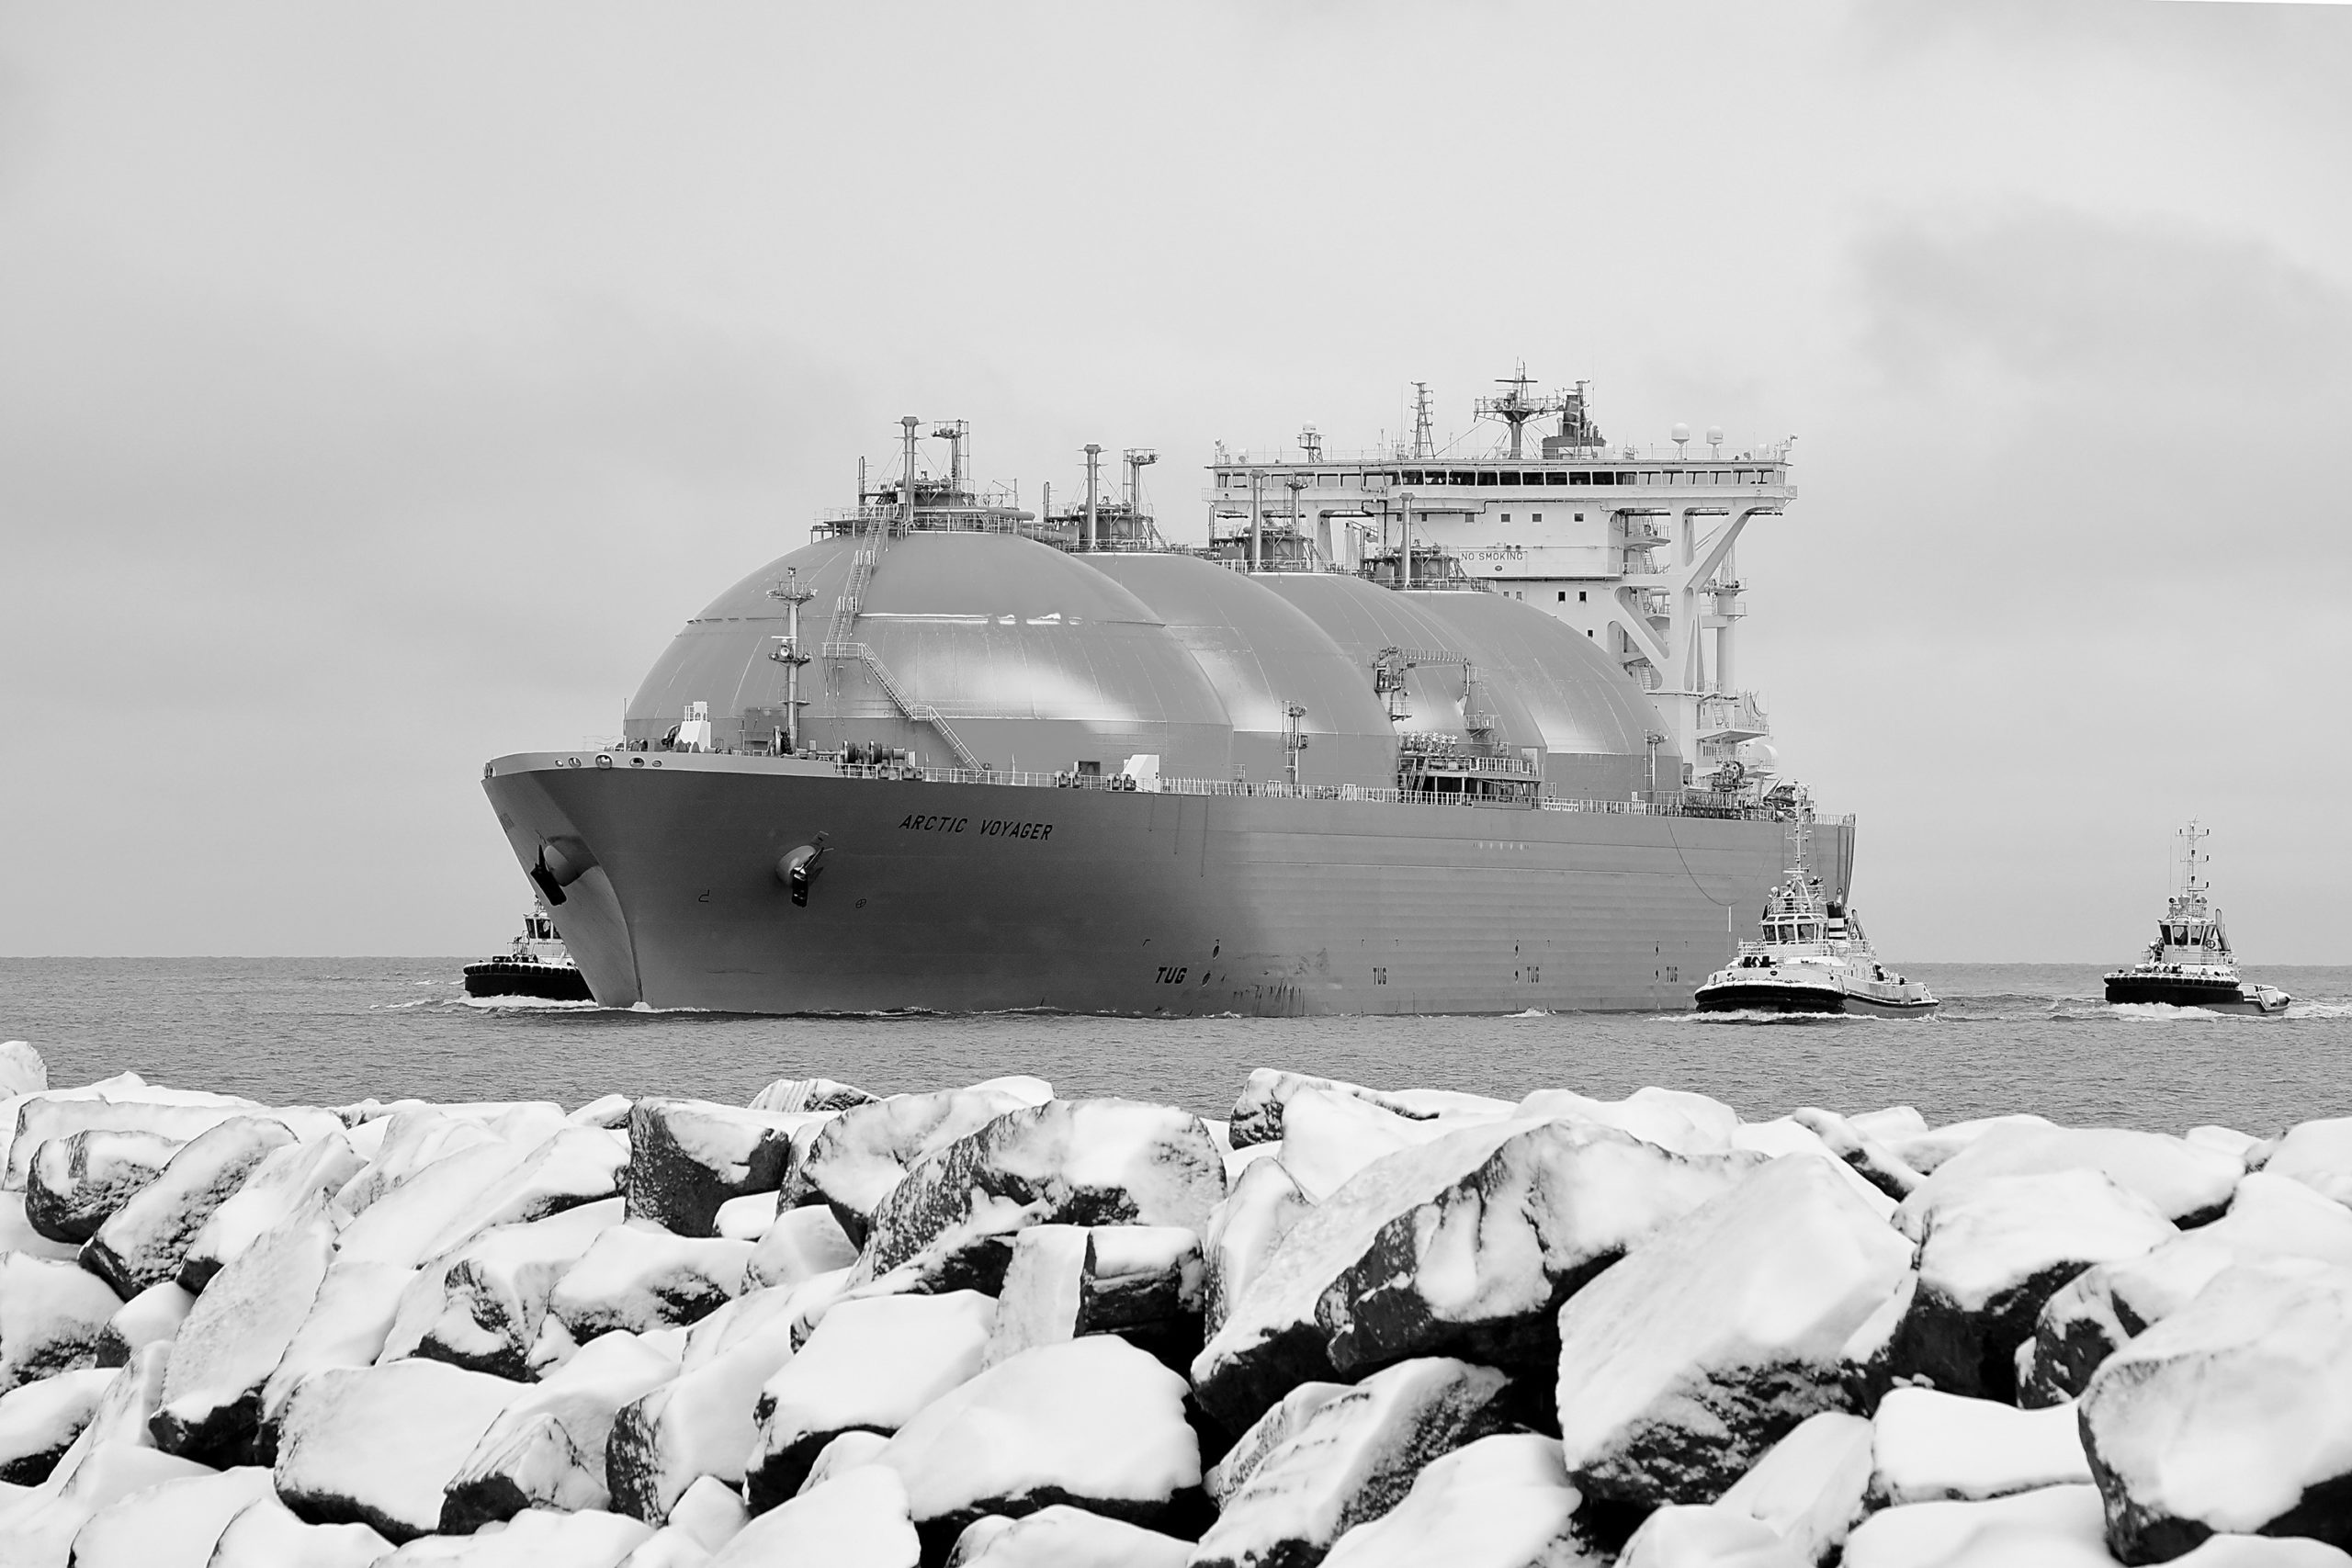
The global LNG fleet consists of around 380 vessels.  The standard size for an LNG carrier has traditionally been 155,000 mcm.  However over the last 3 to 4 years the size of many delivered carriers has increased to 170,000 mcm as infrastructure has evolved to deal with larger vessels.

For the Qataris, size is everything.  They have developed their own fleet of Q-Max carriers with a capacity of 267,000 mcm.  Liquefaction terminals in Qatar are specifically designed to cater for these large carriers, with the benefit of size being lower energy requirements (~40%) given economies of scale with engine efficiency.

The fundamental drivers

Historically, source to destination LNG contracts backed by dedicated shipping capacity made the forecasting of shipping capacity requirements relatively straight forward.  However over the last decade, the evolution of LNG portfolio optimisation and growth in trading of spot cargoes has resulted in shipping market dynamics becoming much more complex.

Despite this complexity, demand for LNG shipping capacity can be broken down into two main drivers:

  1. The volume of LNG to be shipped.  Higher LNG demand means higher demand for shipping capacity.
  2. Average journey time and the proportion of ballasted (un-laden) voyages.  These factors are a function of the pattern of LNG trade flows, with longer average voyages and a higher proportion of ballasted voyages requiring more shipping capacity to move a given volume of LNG.

In other words, understanding LNG trade flows as well as global LNG demand growth is important in understanding tightness in LNG shipping capacity.
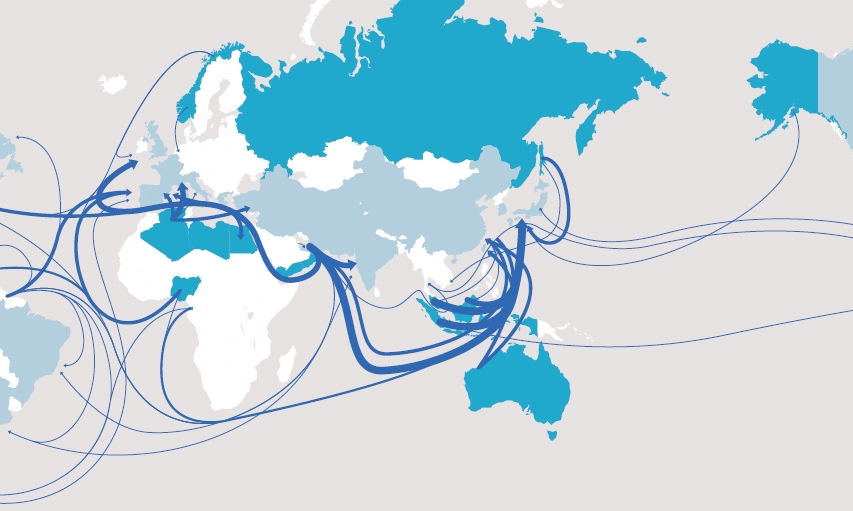
LNG shipping flows

The shipping of LNG is focused on moving gas from producing nations to Asia. Key shipping routes include the Middle East to Asia, Australasia and South East Asia to Northern Asia and Africa to Southern Europe as illustrated in the schematic in Diagram 1.

Diagram 1: Global LNG trade flows 2012 (GIIGNL)

Since the Fukushima crisis, shipments to Asia have been bolstered by the diversion of gas originally intended for Europe.  This has had the effect of increasing both average voyage times and ballasted voyages, supporting the demand for LNG shipping capacity.  Diagram 2 shows 2012 LNG shipping flows by destination, with Diagram 3 illustrating how incremental flows have shifted with the diversion of European gas to Asia.

Diagram 2: Global LNG flow by destination in 2012

Source: GIIGNL, Timera Energy

Diagram 3: Incremental changes in LNG demand in 2012

Source: BG Group

The shipping outlook

Historically, the delivery of new LNG carriers has been somewhat out of sync with LNG market demand for shipping capacity.  The primary issue is that there is typically a 2 to 3 year lead time for ship delivery.  The cyclical nature of ship delivery is illustrated in Diagram 4.

Diagram 4: LNG carrier fleet & order book

Source: Clarksons, Teekay

This cyclicality has resulted in some pronounced fluctuations in shipping market balance, with the impact on spot charter rates illustrated in Diagram 5.

Diagram 5: LNG spot charter rates

Source: Fearnleys Research, Jefferies

  • 2009-10 glut: A large volume of new carriers were delivered between 2007-09.  This in part matched rapid growth in liquefaction capacity but it also coincided with the onset of the financial crisis and a rise in US gas self sufficiency.  A shipping glut ensued with spot charter rates ranging from $25,000-$60,000 a day.  The glut also negatively impacted orders for new vessels.
  • 2011-12 boom: Post-Fukushima Asian demand caused a sharp reversal in shipping returns.  Not only was there a rapid increase in spot demand from Japanese buyers, but average voyage mileage increased as gas was diverted from all over the world to meet the Asian shortfall.  A lack of new shipping capacity also contributed to market tightness.  Between Q2 2011 and Q2 2012, spot charter rates almost tripled from around $60,000 to upwards of $160,000.
  • 2014-15 glut?: Spot charter rates in 2013 settled around 90,000 $/day.  However 2014 may mark the start of the next glut in LNG shipping capacity.  Diagram 4 illustrates the substantial order book of LNG carriers to be delivered over the 2013-15 horizon.  These ships will be entering the market during a period when there is little growth in new liquefaction capacity to absorb new shipping capacity.  The capacity surplus is likely to continue until at least 2016, as shown in Diagram 6, when volume ramps up from new Australian liquefaction and US export projects.
Diagram 6: Projected LNG carrier supply/demand balance

Source: Clarksons, Teekay

The extent to which this period of shipping oversupply extends into the second half of the decade will largely come down to:

  • The rate of emerging market LNG import demand growth – a factor to which the whole LNG market is hostage
  • The timing and extent of delays in liquefaction capacity projects in Australia and the US
  • The impact of this new liquefaction capacity on global LNG shipping flows, e.g. by shortening average journey times

The development of new LNG shipping capacity has the potential to send spot charter rates back towards the 2009-10 glut levels.  LNG diversion to Asia is an important factor which is currently helping to support shipping charter rates.  But beyond this it will take new liquefaction capacity to soak up the new vessels being built.  So as sparks fly in the shipyards, ship owners are likely to be praying for a continuation of robust Asian spot prices and the timely development of Australian and US export projects to contain the damage.

Steam coming out of the LNG shipping market