“Lower wholesale prices, tighter funding”
In October 2024 the UK Government committed £21.7bn over 25 years to the UK’s first carbon capture, usage and storage (CCUS) clusters: the East Coast Cluster on Teesside and the HyNet North West cluster in Merseyside and North Wales. Around three quarters is expected to be recovered through energy bills.
Affordability is now a central test for further support. Our modelling shows CCUS reducing GB baseload wholesale power prices by around 5% by 2040. This does not establish the net impact on consumer bills after support costs.
Why the Government is supporting CCUS
CCUS captures CO2 from industrial sites and power stations and stores it under the seabed. The Government sees it as essential for three reasons:
- It offers heavy industries such as cement and chemicals one of few routes to decarbonisation.
- It underpins low-carbon hydrogen production.
- It allows gas plants to provide firm, dispatchable power whilst capturing most of their emissions.
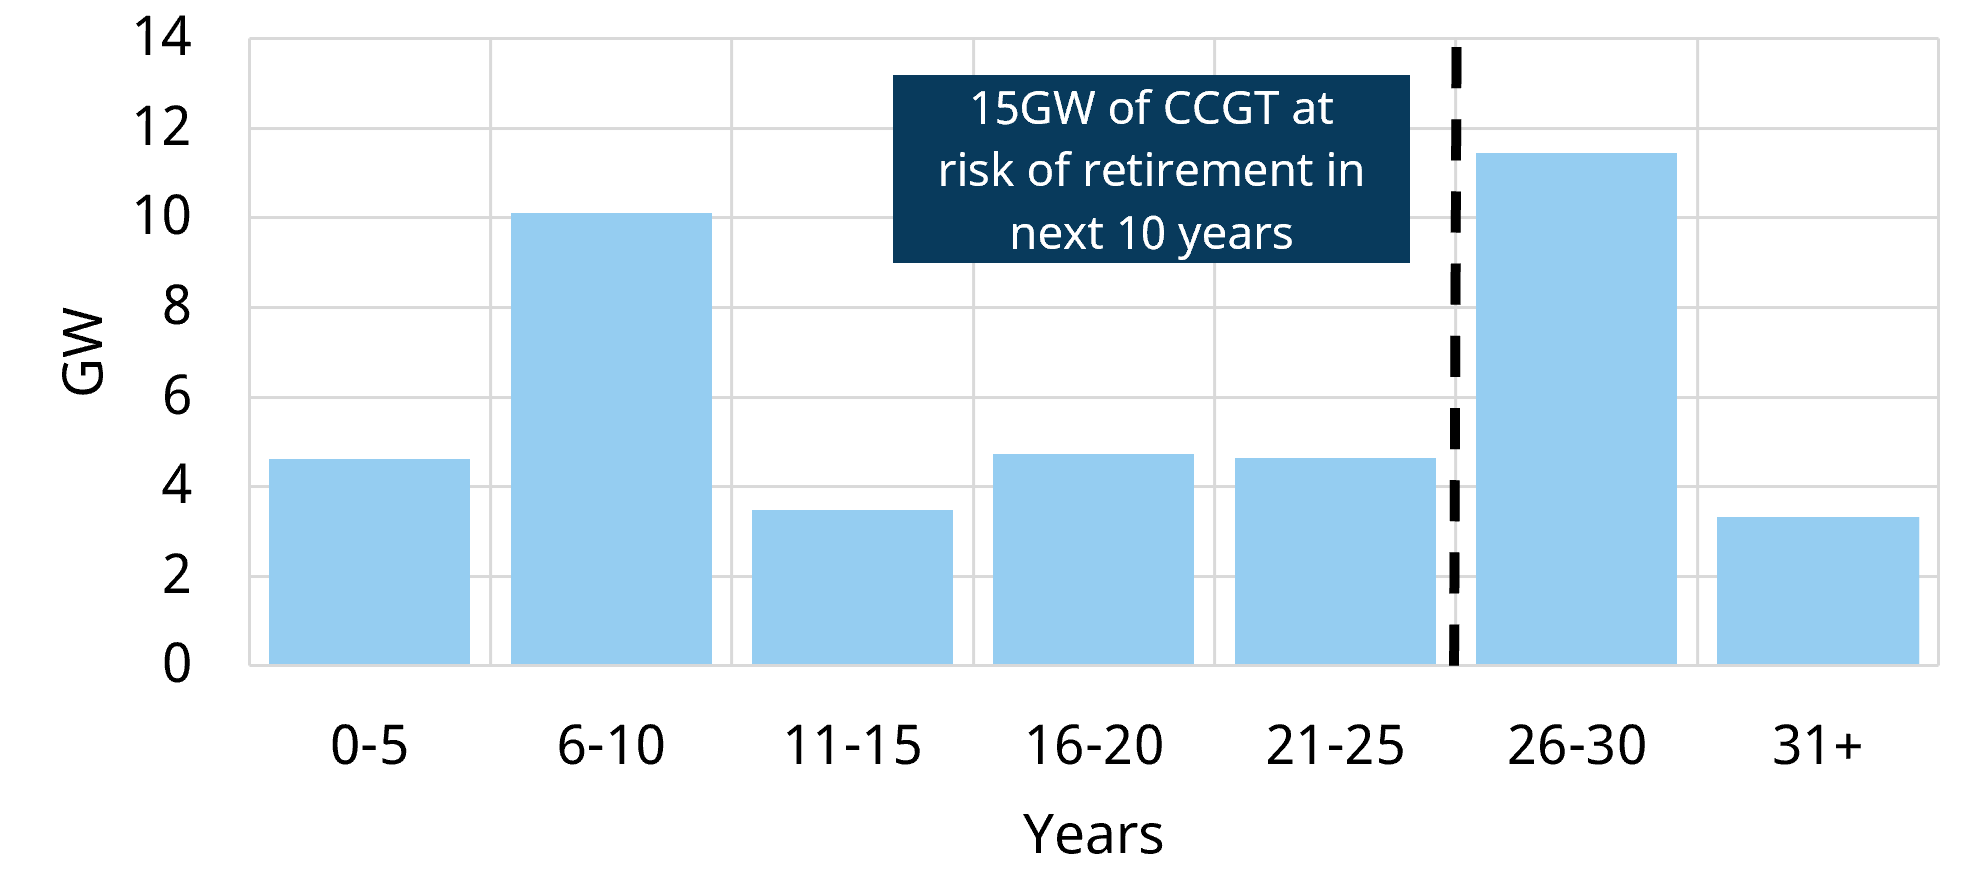
Two power sector drivers strengthen the case for CCGT combined with CCUS. First, around 15GW of existing CCGT capacity is at risk of retirement over the next 10 years (Chart 1). Electrification is expected to increase demand, while generation increasingly depends on wind and solar. This creates a need for firm capacity, which CCGT+CCUS could help meet.
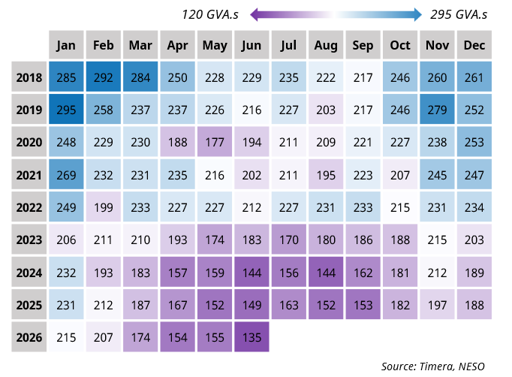
The second driver is system stability. Spinning turbines provide inertia, which slows frequency changes after a fault and gives NESO time to respond. Wind and solar do not inherently provide it. Chart 2 shows monthly average GB inertia falling from above 200GVA.s in 2018 to 135GVA.s in June 2026. These averages show the declining trend, rather than the lowest inertia levels within each month.
Other technologies can provide inertia, but CCUS-equipped CCGTs combine dispatchable capacity and system stability with much lower emissions than unabated gas.
Bill payers carry most of the cost for carbon capture
The bill-funded share of the £21.7bn averages roughly £0.65bn a year if spread evenly over 25 years; the Exchequer funds the remainder.
Chart 3 compares this with existing bill-funded schemes. On OBR forecasts, the Renewables Obligation, Contracts for Difference (CfDs) and the Capacity Market together average around £12bn a year over the next six years; the CCUS levy is equivalent to around 5% of that.
Chart 3: Average annual cost of support schemes funded through energy bills (£bn/yr)
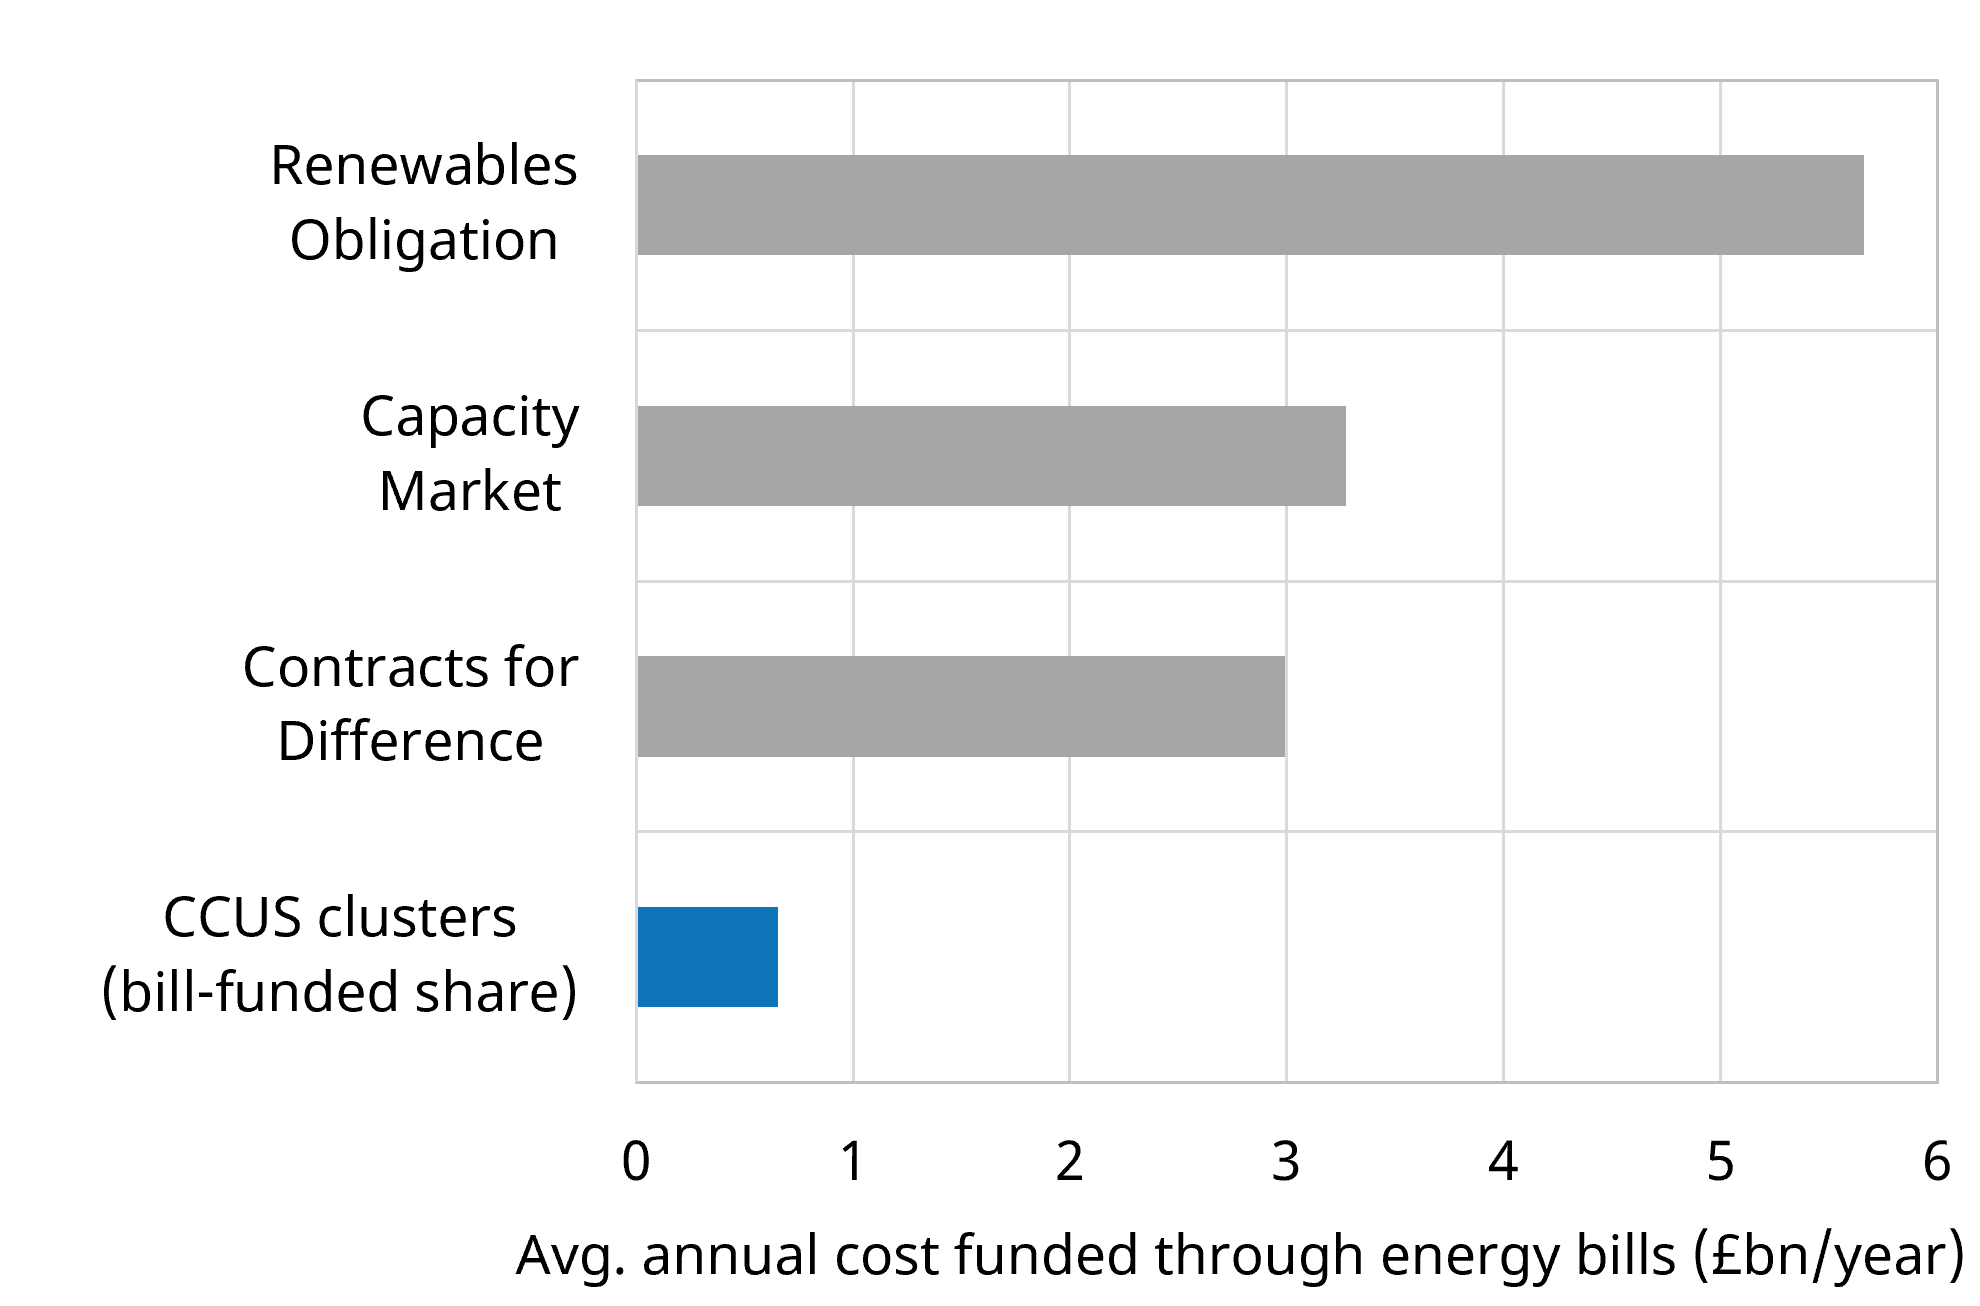
Note: Renewables Obligation, Capacity Market and CfDs are OBR forecast averages for 2026-27 to 2031-32 (nominal). RO is shown net of the Exchequer-funded share (75% of domestic RO costs, 2026-27 to 2028-29, per Budget 2025 costings). CCUS is £21.7bn × ~75% levy share ÷ 25 years.
Support for low-carbon technology is losing momentum
Net zero by 2050 remains Government policy, but affordability constrains further support. The OBR forecasts environmental levies rising from £14bn this year to £16bn by 2031-32. Funding faces two pressures.
Ministers will pause after AR8 to review consumer value before AR9. Until a Cost Control Framework is in place in 2027, new policy costs on bills must lower bills or be essential for security of supply. CCUS power contracts use the same levy as CfDs.
Taxpayer funding is also constrained: the Autumn Budget 2026 moved £200m away from CCUS capital grants and £500m of hydrogen funding to defence.
The first clusters in Teesside, Merseyside and North Wales remain a priority. Further support faces a tougher affordability test.
What our modelling shows
We compared two scenarios: our Timera Central scenario with ~9GW of CCUS-equipped CCGTs by 2040, and a counterfactual in which the same capacity is built as unabated CCGT instead.
GB wholesale prices are set by the most expensive plant needed to meet demand, usually a CCGT. As carbon prices rise, unabated CCGTs become more expensive to run than CCUS plants, which pay for only a fraction of their emissions. When CCUS sets the price, the marginal price is thus lower.
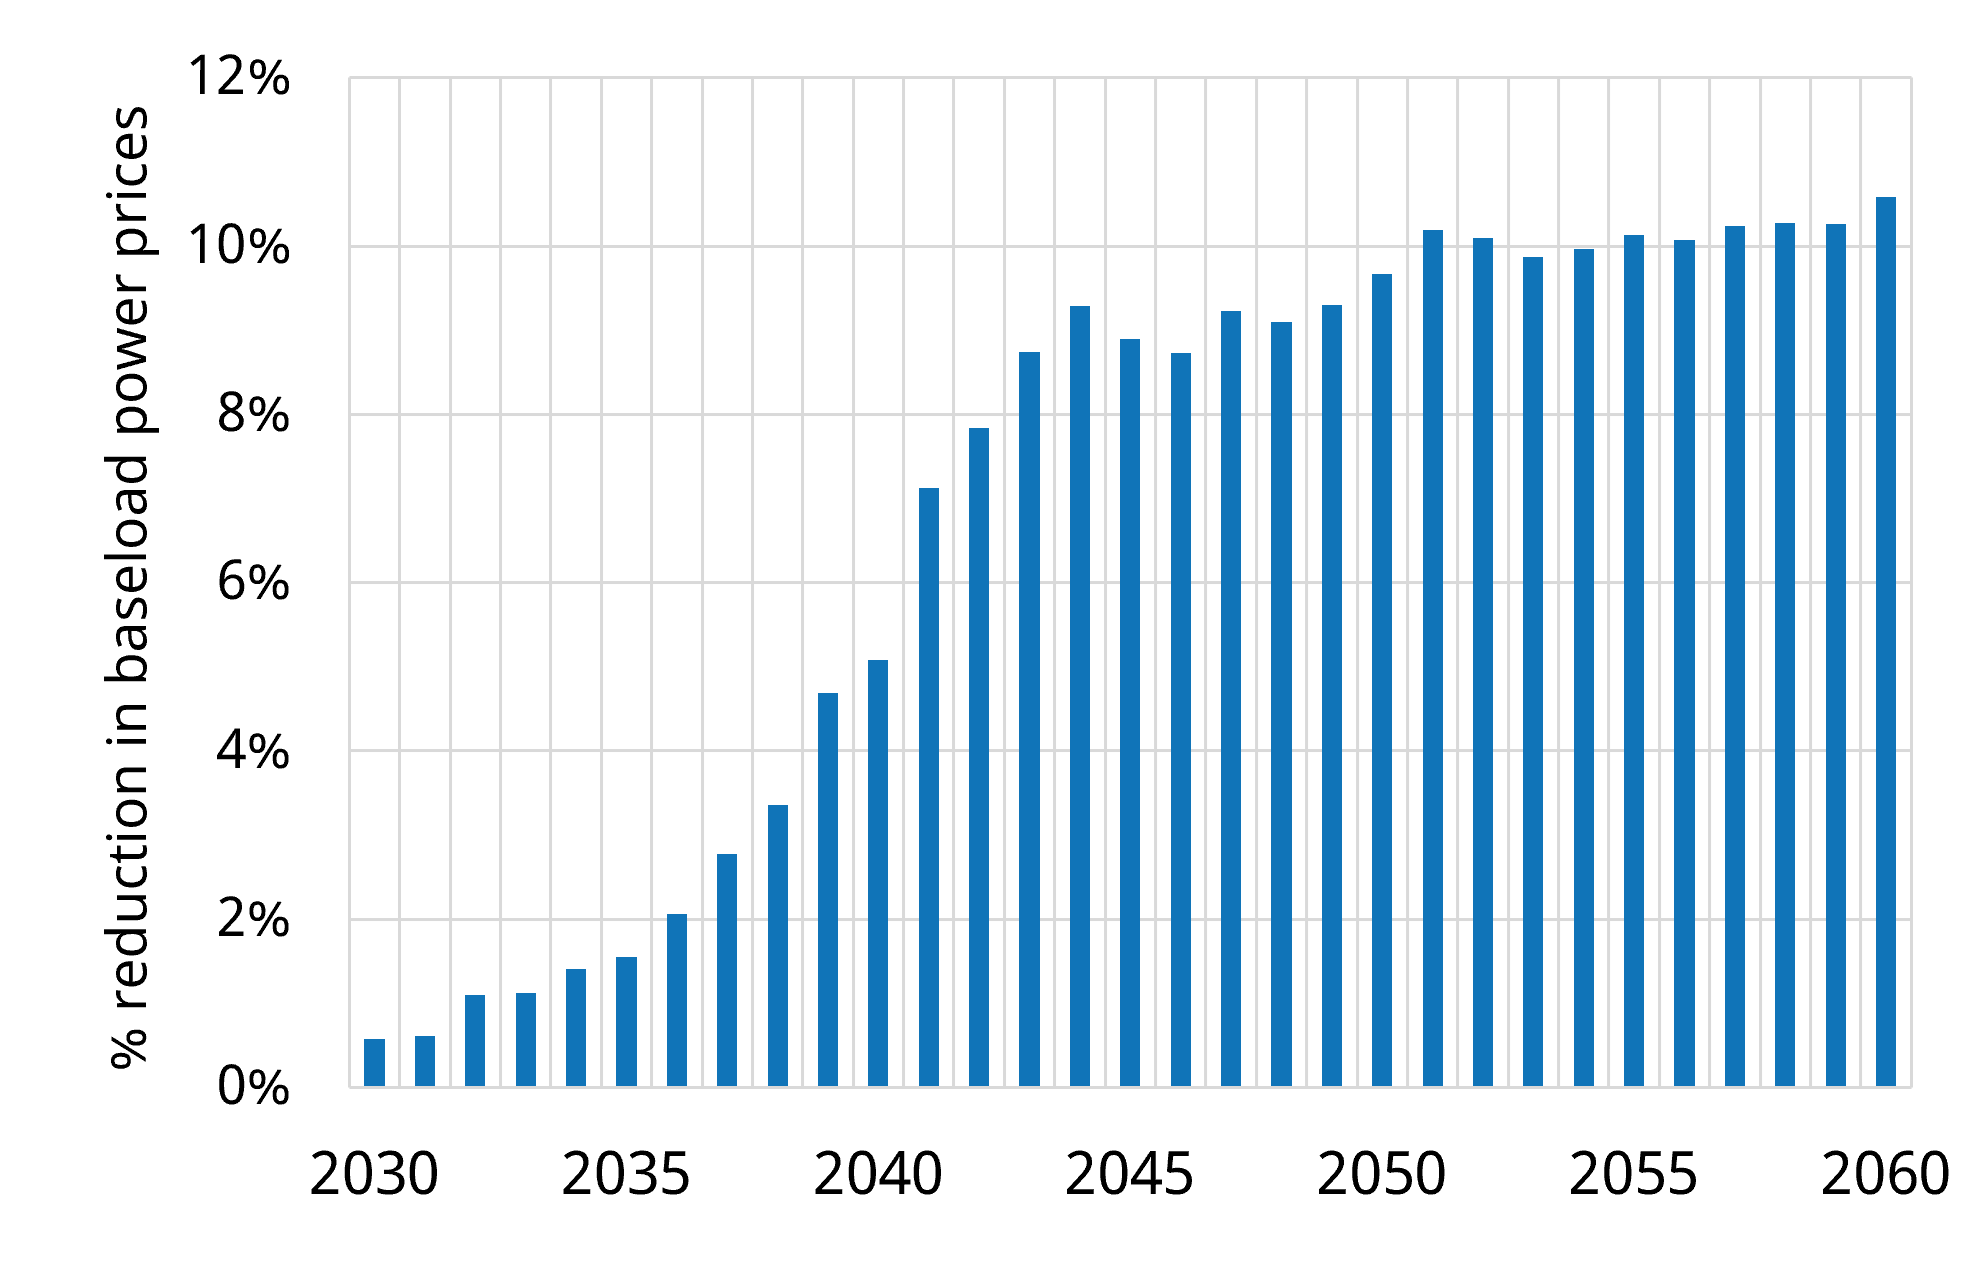
Chart 4 shows baseload prices lower with CCUS in every modelled year: under 2% on average through the 2030s, ~5% by 2040 and ~9% in the mid-2040s, approaching 10% by 2050. Rising carbon prices drive the growing saving.
The emissions benefit follows the same pattern. Without CCUS, modelled power sector emissions level off at around 8MtCO2 a year from the 2040s; with CCUS they fall to around 3.5–4Mt, roughly halving the sector’s remaining emissions. Cumulatively, around 67MtCO2 is avoided by 2050.
What this means for CCUS
Three implications stand out for further CCUS investment:
- The first clusters are prioritised; the policy risk sits with the pipeline beyond them. Projects outside Teesside, Merseyside and North Wales face a tougher route to support, with grants likely to give way to loans or equity.
- New support must demonstrate value for money, considering wholesale price benefits alongside support costs, emissions reductions and security of supply.
- System value strengthens the case. As the CCGT fleet retires and inertia falls, CCUS plants that provide firm capacity and stability are better placed to meet the security of supply test.
For flexible asset investors, CCUS deployment affects the wholesale price environment and associated revenue opportunities. Investment decisions need to test different CCUS build-out pathways alongside renewable deployment and other flexible capacity, assessing the impact on asset revenues and portfolio risk.
How can we help?
Timera’s stochastic modelling quantifies the distribution of potential revenues across wholesale, BM and ancillary markets, rather than relying on a single deterministic case.
Together, these tools help investors quantify upside, downside and the durability of different revenue sources when valuing assets and assessing route-to-market risk. If you would like to find out more, reach out to our Steven Coppack (Director, Power) at steven.coppack@timera-energy.com.