“Europe is pricing up to outcompete Asia for marginal LNG”
European and Asian gas prices have surged as the market adjusts to a more prolonged disruption to LNG supply.
TTF and JKM forward curves reached new 2026 highs last week. Prices for the coming winter are up around 150% since Q1. Calendar 2027 is up more than 50%. Ongoing supply disruptions and tight European storage inventories are key factors in play.
Very limited LNG volumes have exited the Strait of Hormuz since Mar 2026. The demand response has been led by a combination of lower Asian demand and reduced European storage injections.
However as the European gas market heads into winter with unusually low inventories, its flexibility to absorb further supply or demand shocks is limited. Europe needs to price up to attract adequate volumes of LNG to clear its market.
Let’s look at the current state of play in the global gas market in five charts.
1. Hormuz disruption has become a sustained supply shock
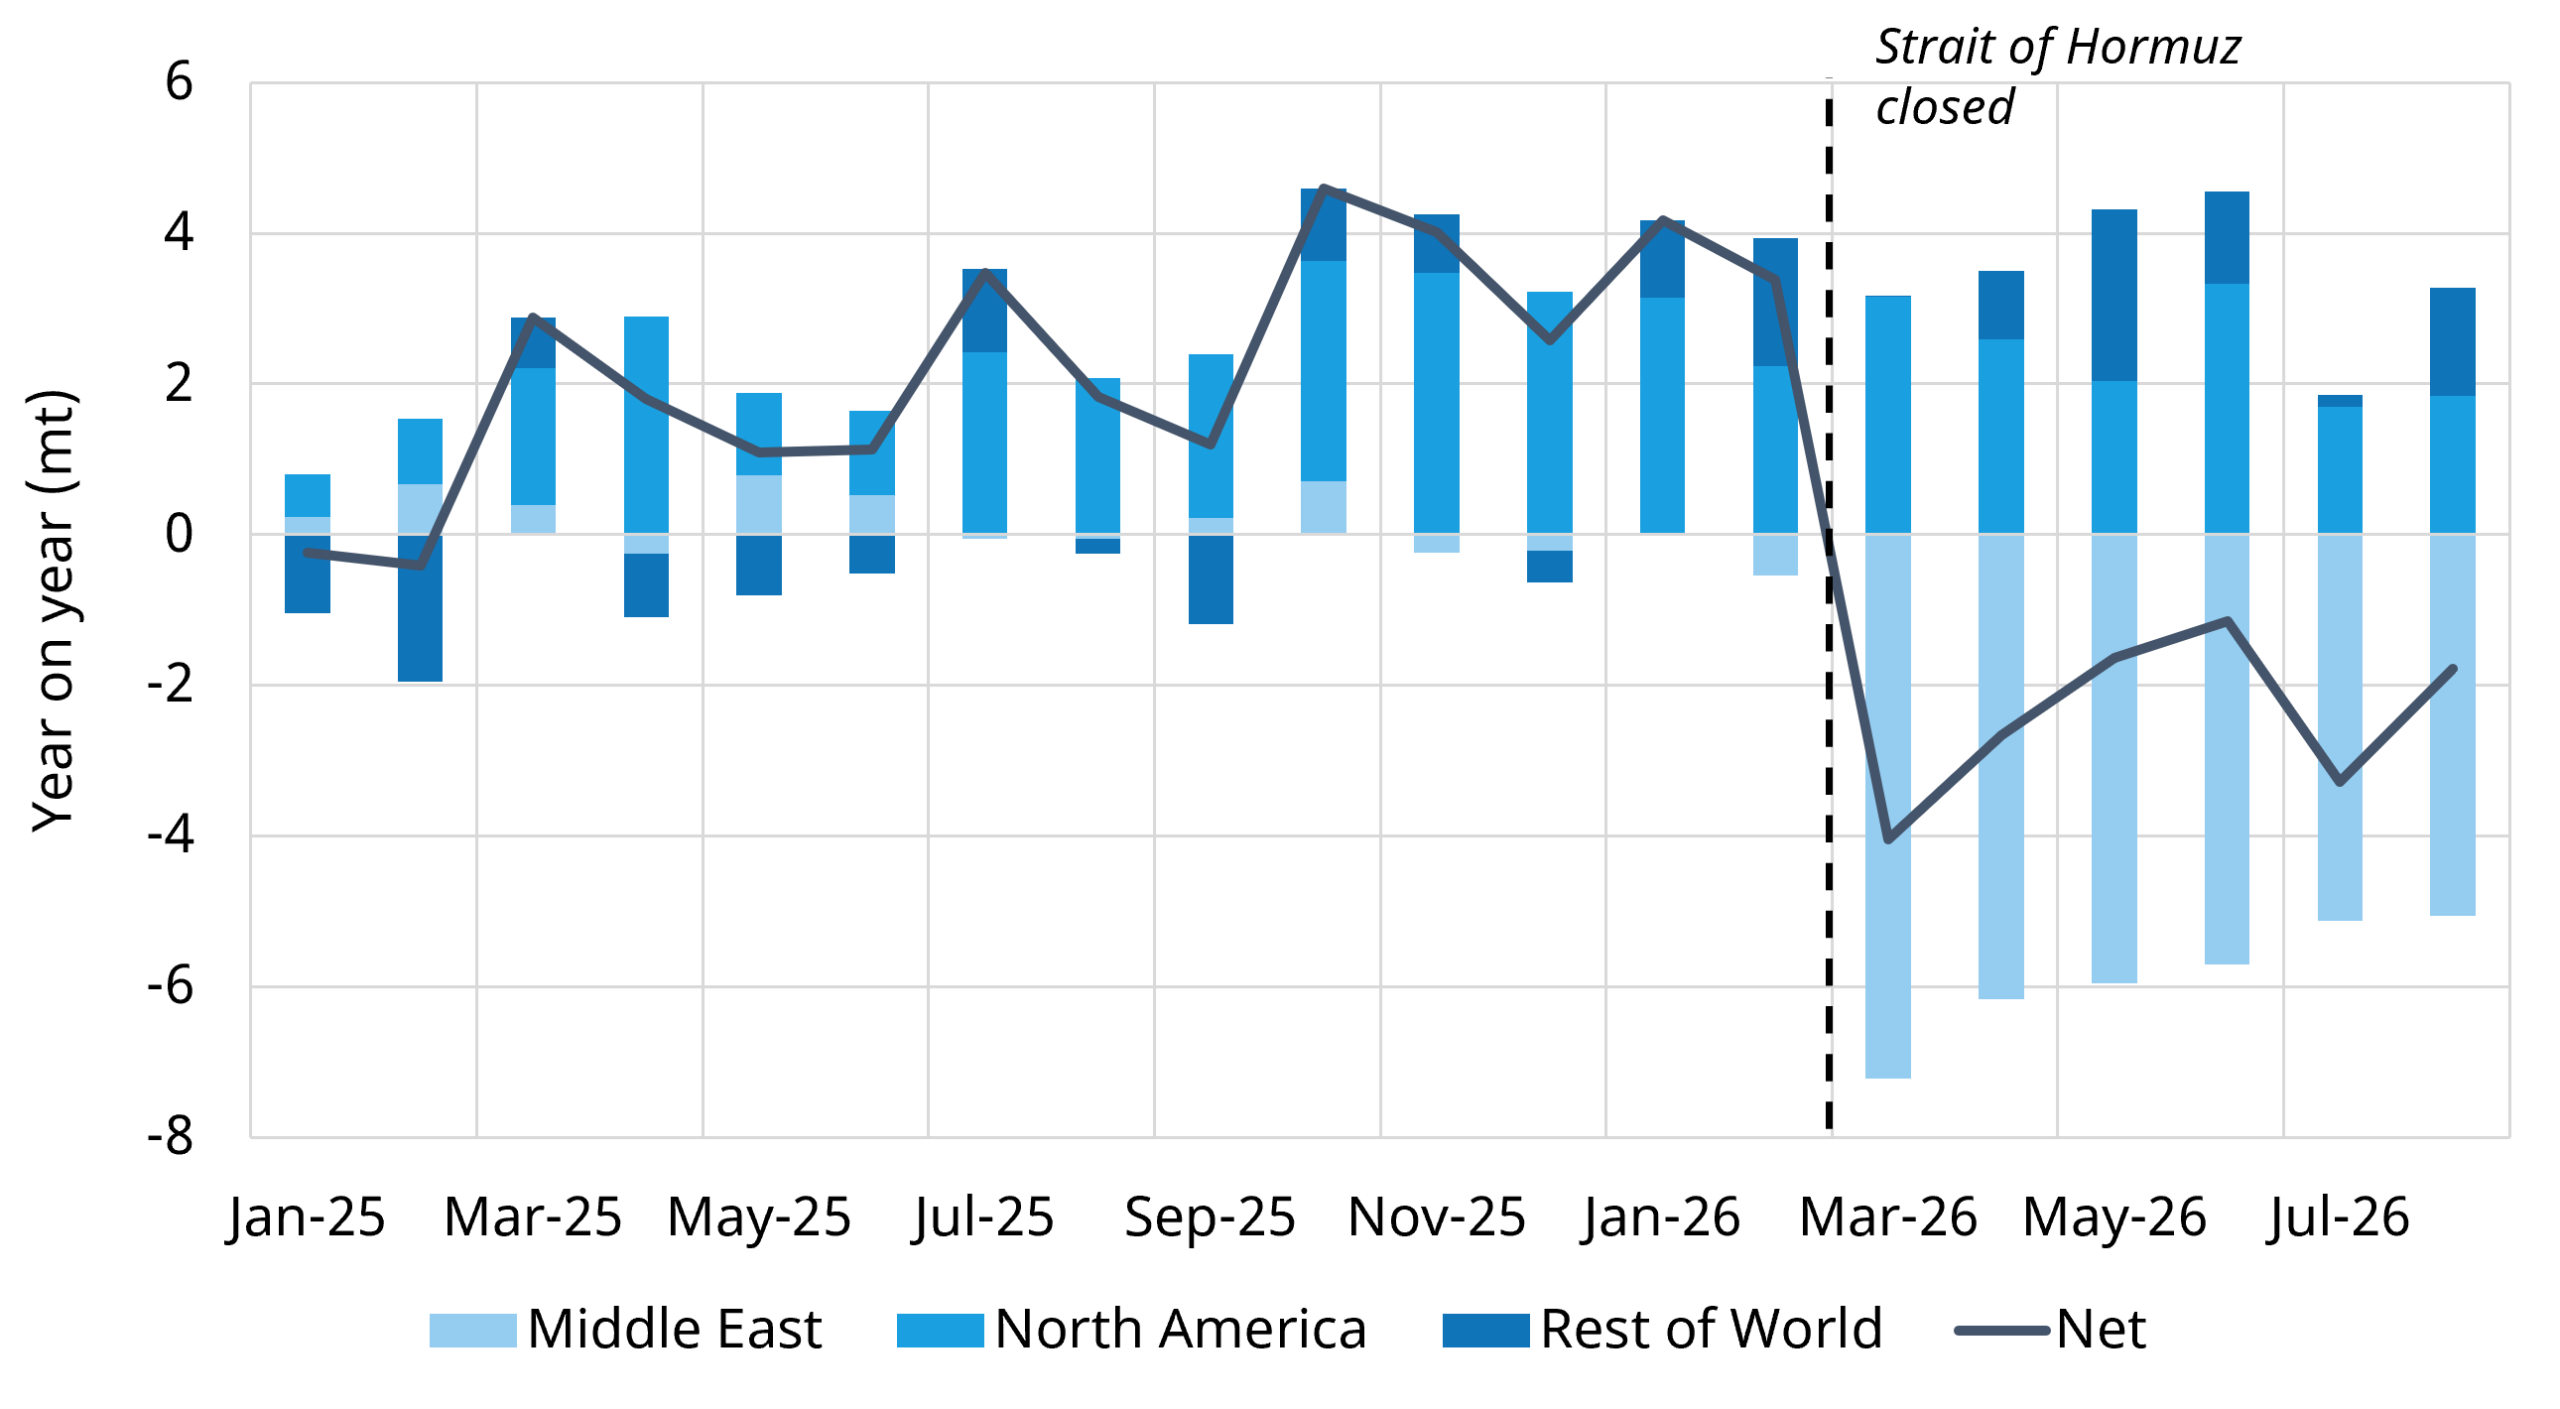
The supply impact from the closure of the Strait of Hormuz is becoming increasingly pronounced. Global LNG supply has deteriorated sharply year on year since the disruption began, reversing stronger growth earlier in the year as shown in Chart 1.
Chart 1: Monthly change in global LNG supply vs prior year by region
Source: Vortexa, Timera
With only limited cargo volumes currently exiting Hormuz, the market is no longer pricing a short-lived interruption. The longer the disruption persists, the greater the requirement for demand elsewhere in the global market to adjust. Even as new supply continues to steadily ramp up it is insufficient to offset the scale of Middle East supply losses in the near term.
2. Asia is doing most of the demand-side balancing
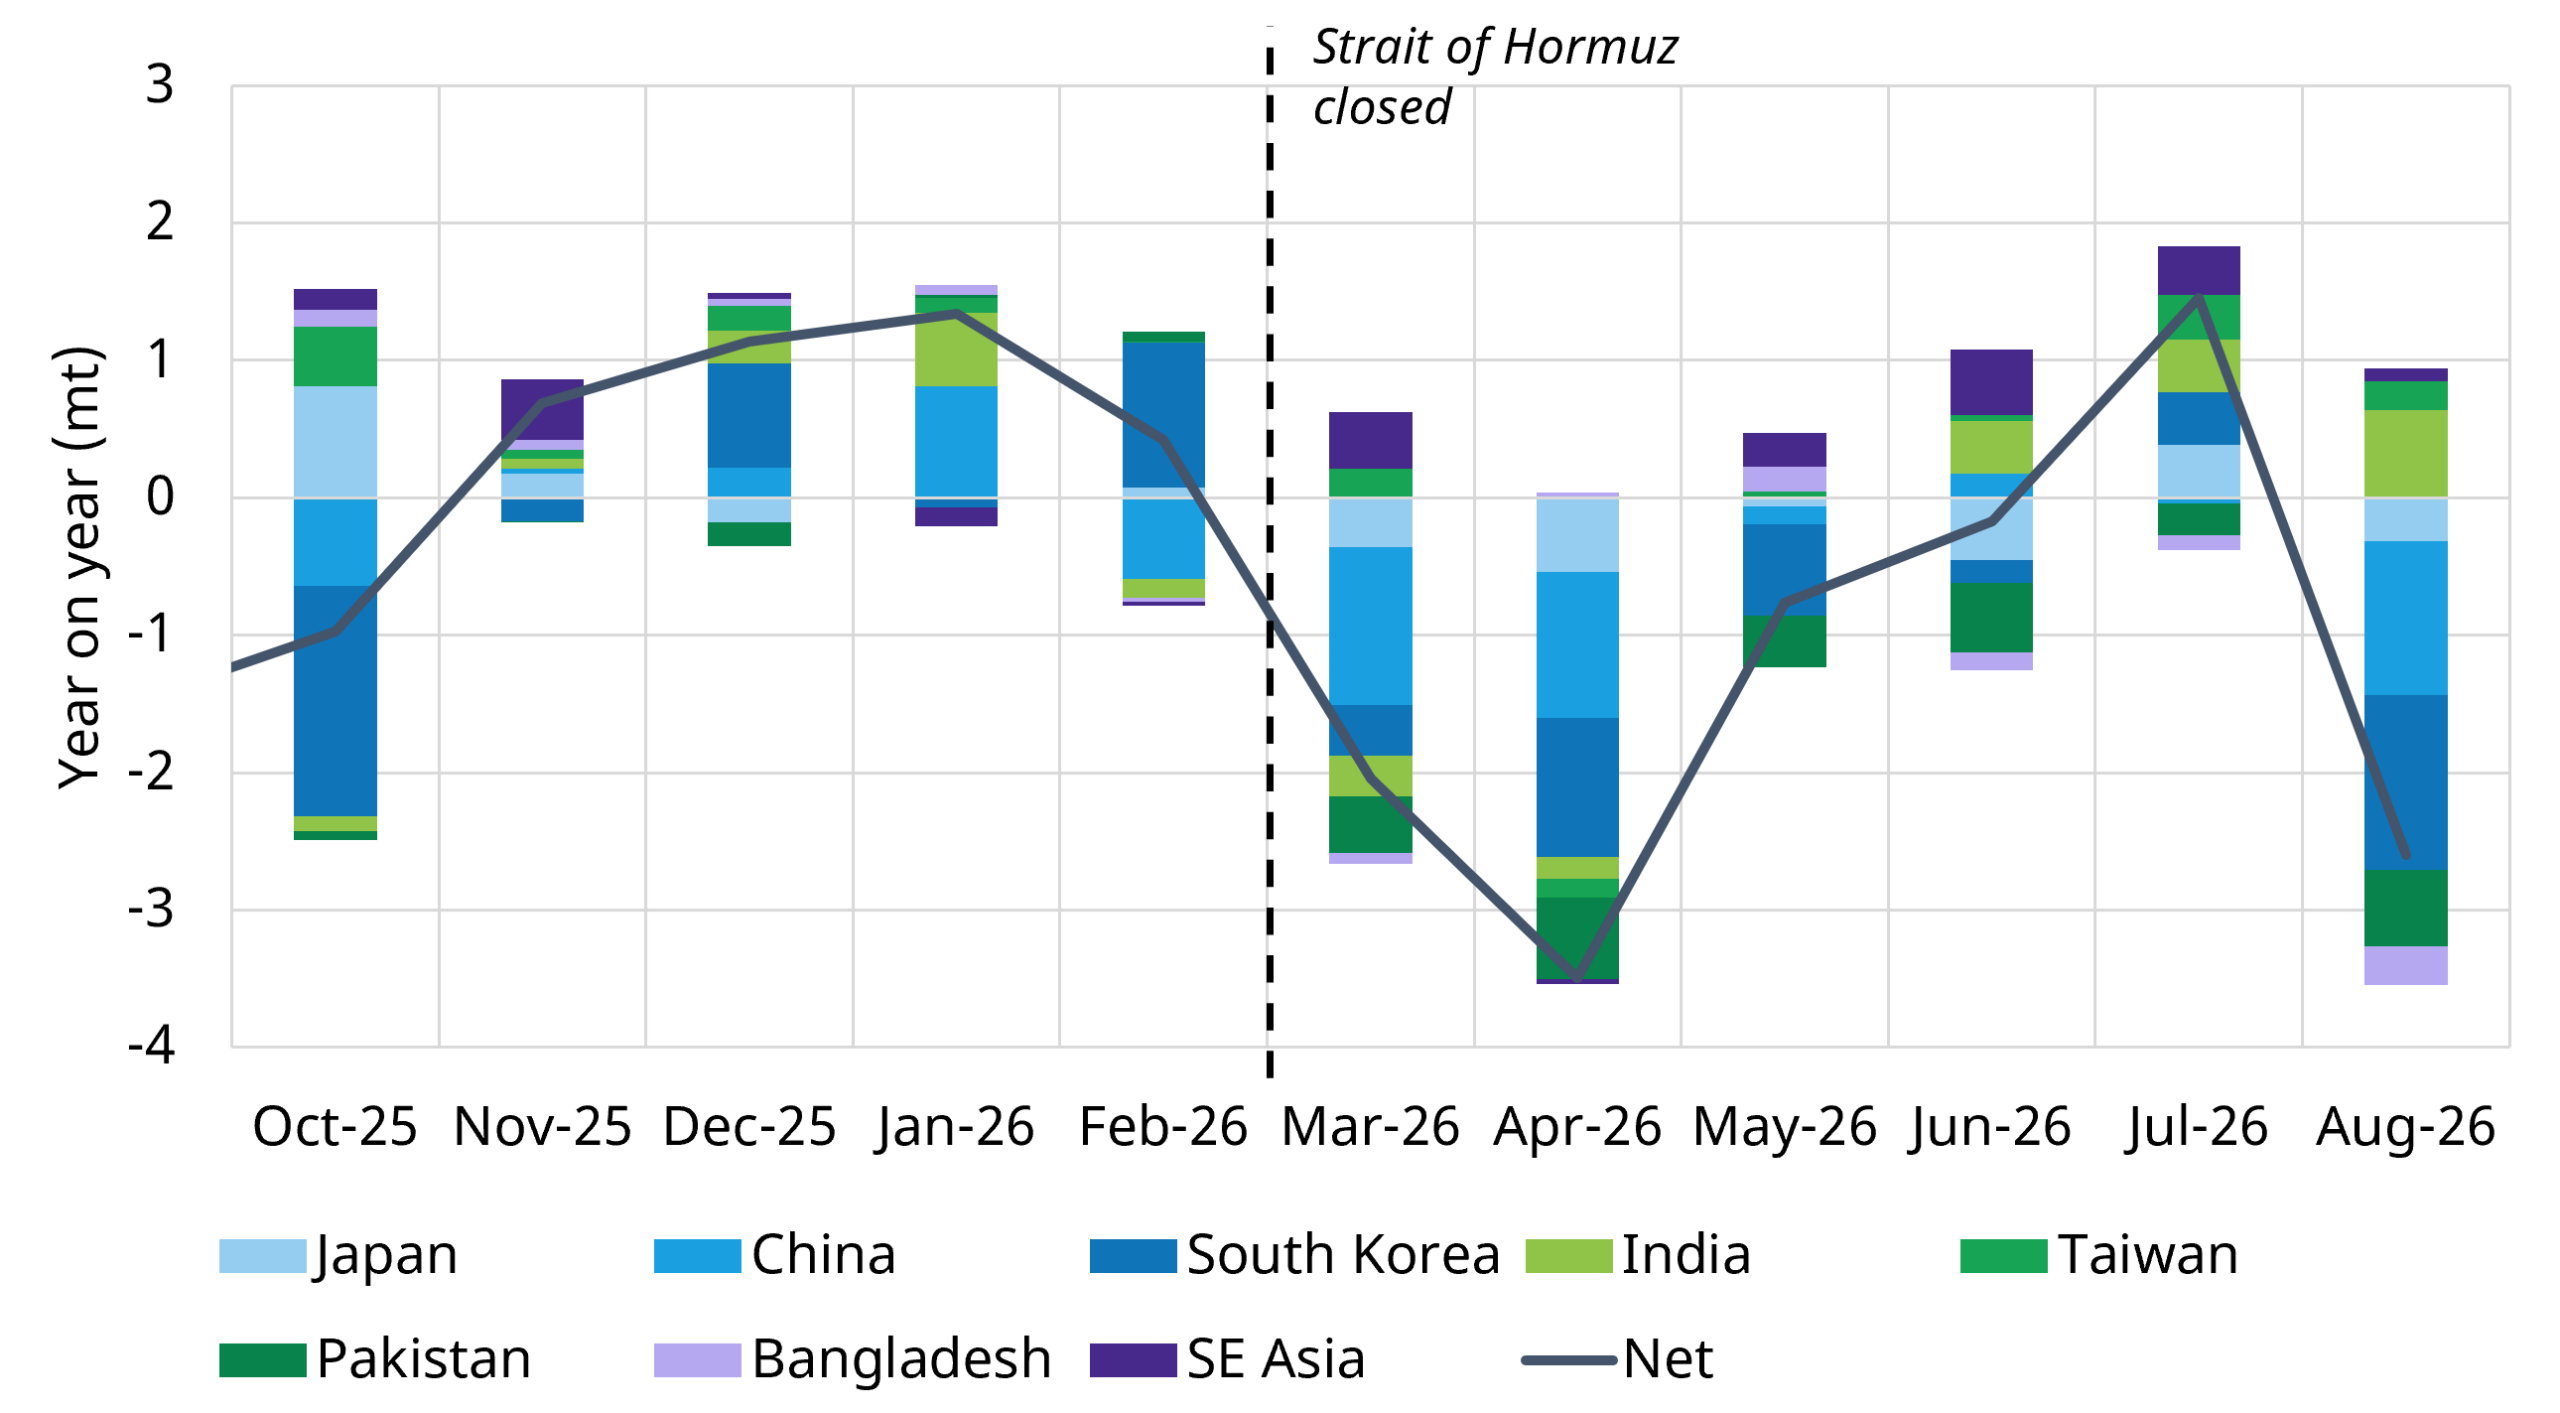
August LNG demand has fallen sharply year on year across several major Asian importing markets as shown in Chart 2. This reflects both fuel switching and outright demand destruction as LNG prices have risen.
Chart 2: Asian LNG demand change vs prior year by market
Source: Vortexa, Timera
The picture is not uniform however. Indian demand has remained relatively resilient, partly because alternative fuels are also expensive. Strong middle-distillate prices have raised switching thresholds, requiring higher gas prices before some consumers have an economic incentive to move away from LNG.
3. Europe has absorbed the shock by sacrificing storage
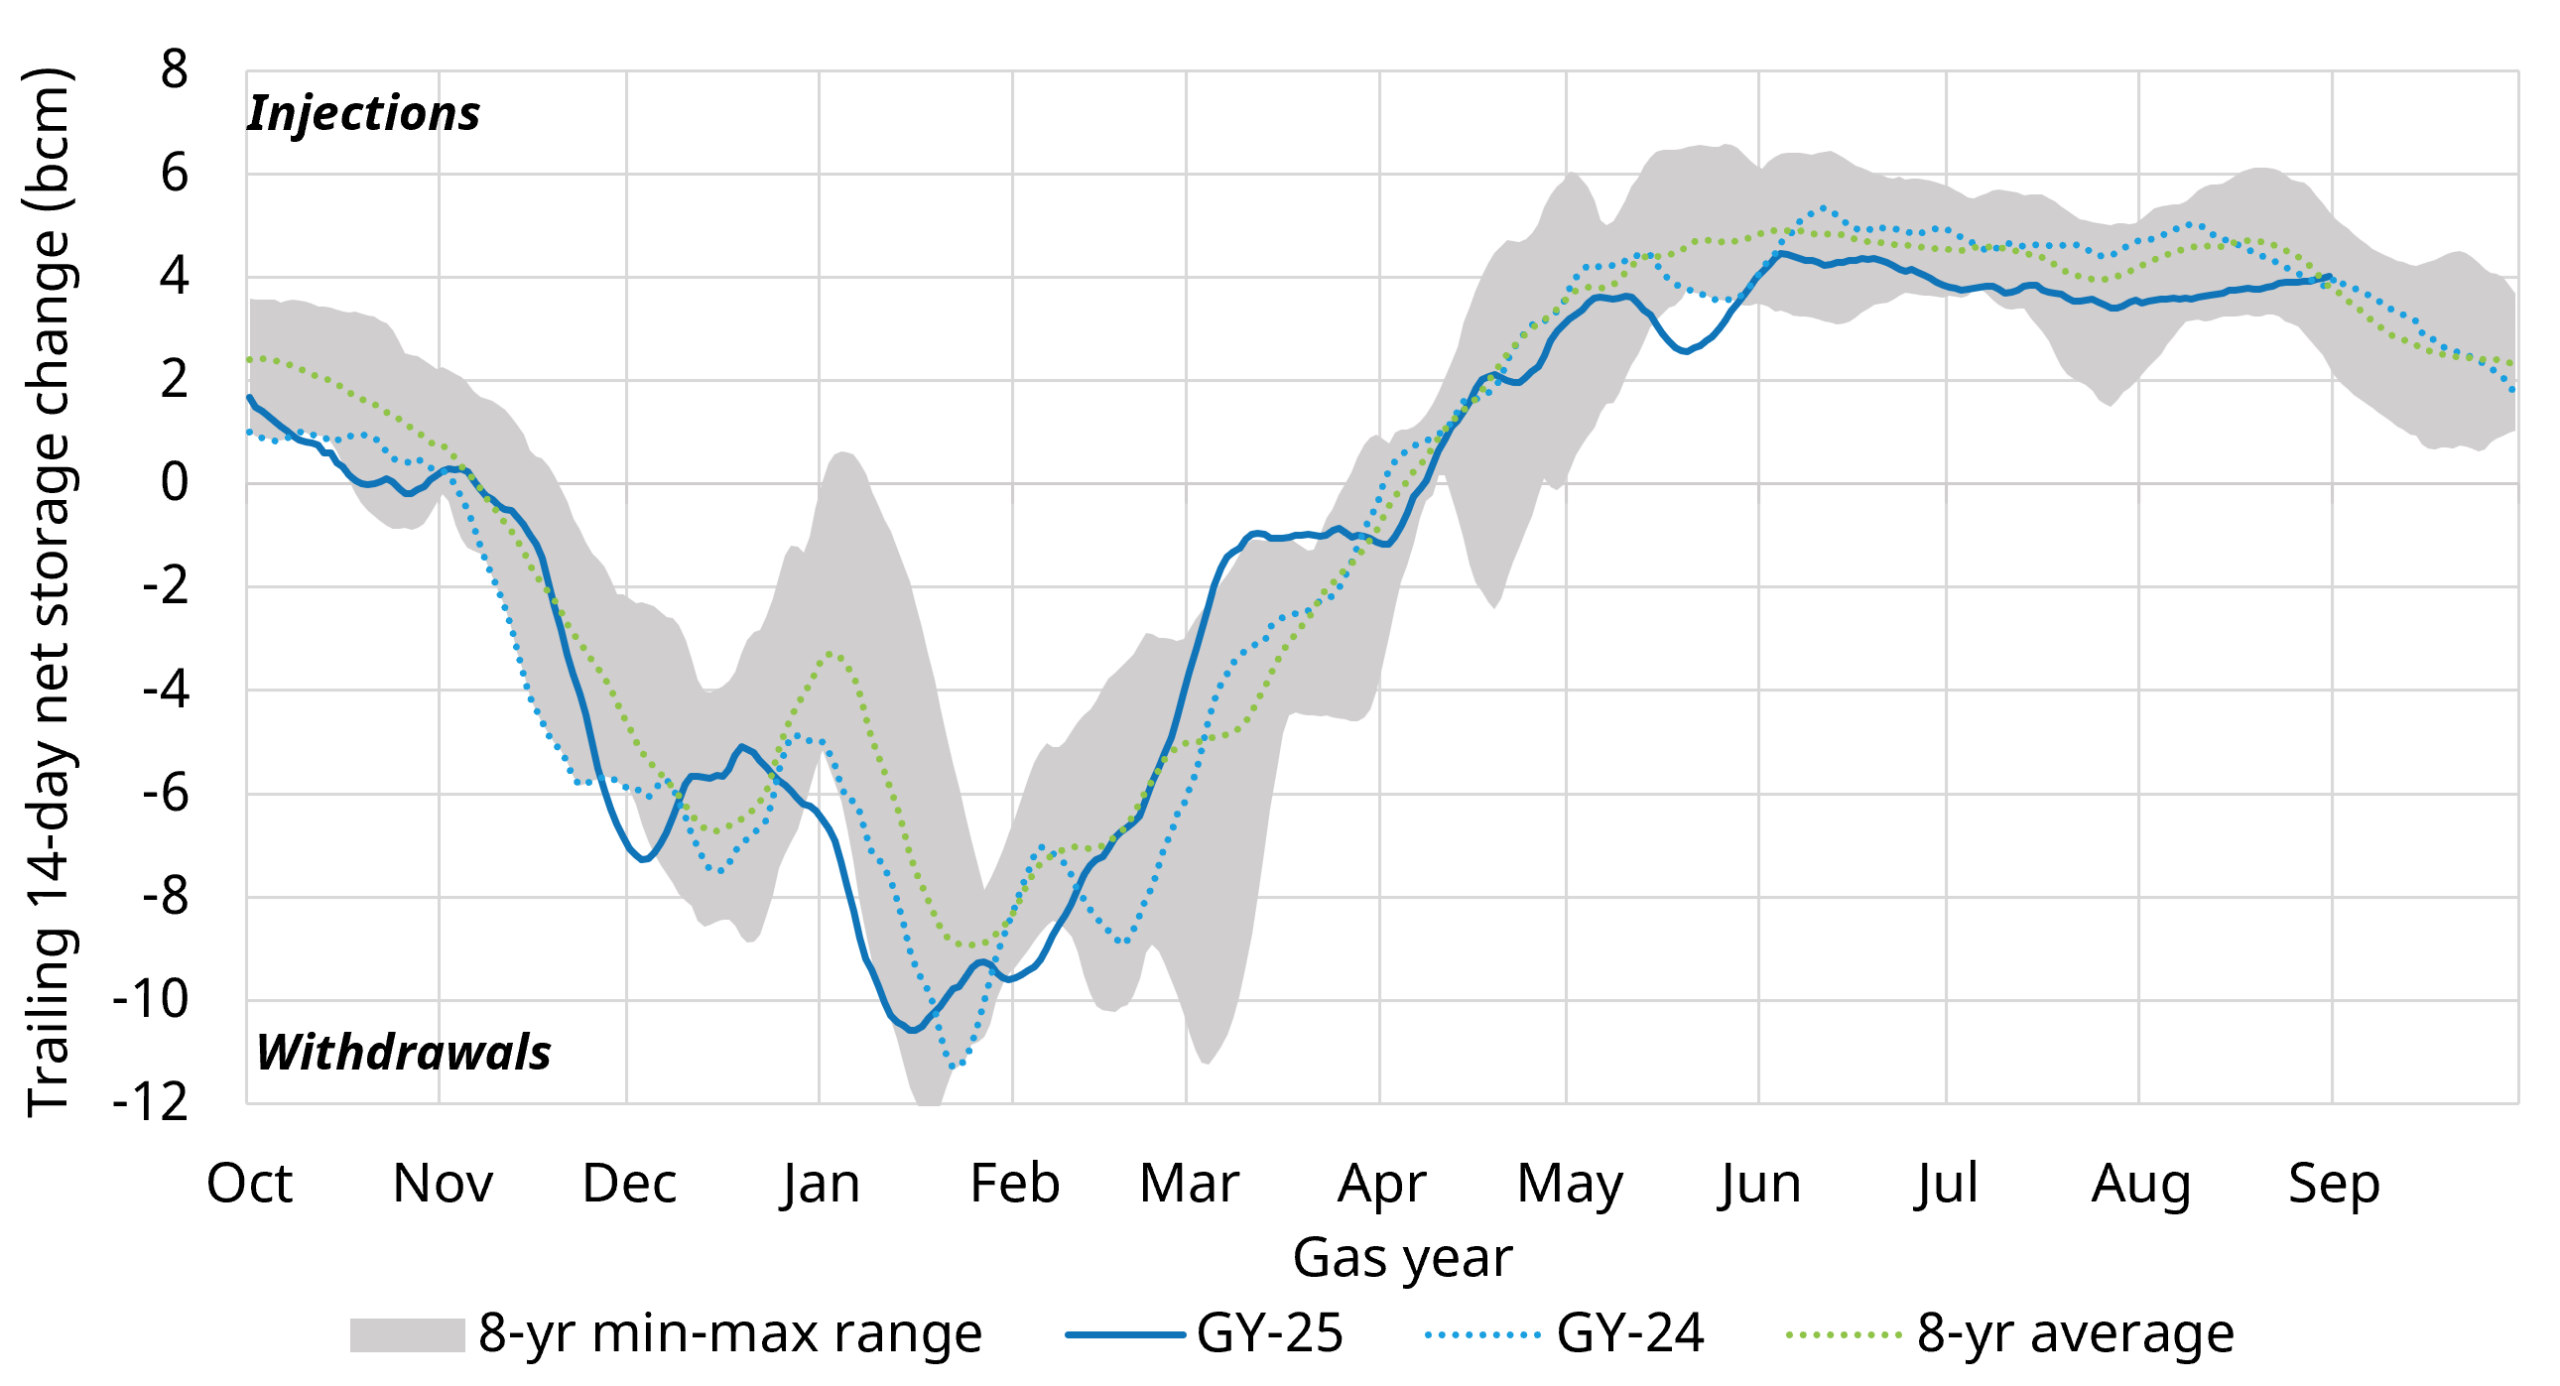
Europe has provided a second important balancing mechanism. Rather than competing aggressively for every lost LNG cargo, European buyers have allowed storage injections to run below normal levels, helping balance the global market through the summer (as shown in chart 3).
That flexibility is however running out. European inventories sit 13 bcm below last years level and 17 bcm below the five-year average. Even with stronger LNG deliveries and above-normal injections through September and October, Europe is set to enter winter with stocks below 80%. The situation is even more acute in Central NW Europe, particularly Germany and the Netherlands.
Chart 3: European underground gas inventory vs historical range
Source: Timera Energy, GIE
4. Europe is being forced to pay up for LNG
As winter approaches, Europe increasingly needs to compete for marginal LNG supply. The JKM-DES NWE spread relative to shipping economics shown in Chart 4 illustrates this shift, with Europe driving global prices higher in a bid to outcompete Asia for flexible Atlantic Basin cargoes since late June.
Chart 4: JKM-DES NWE spread vs Atlantic-Pacific shipping economics
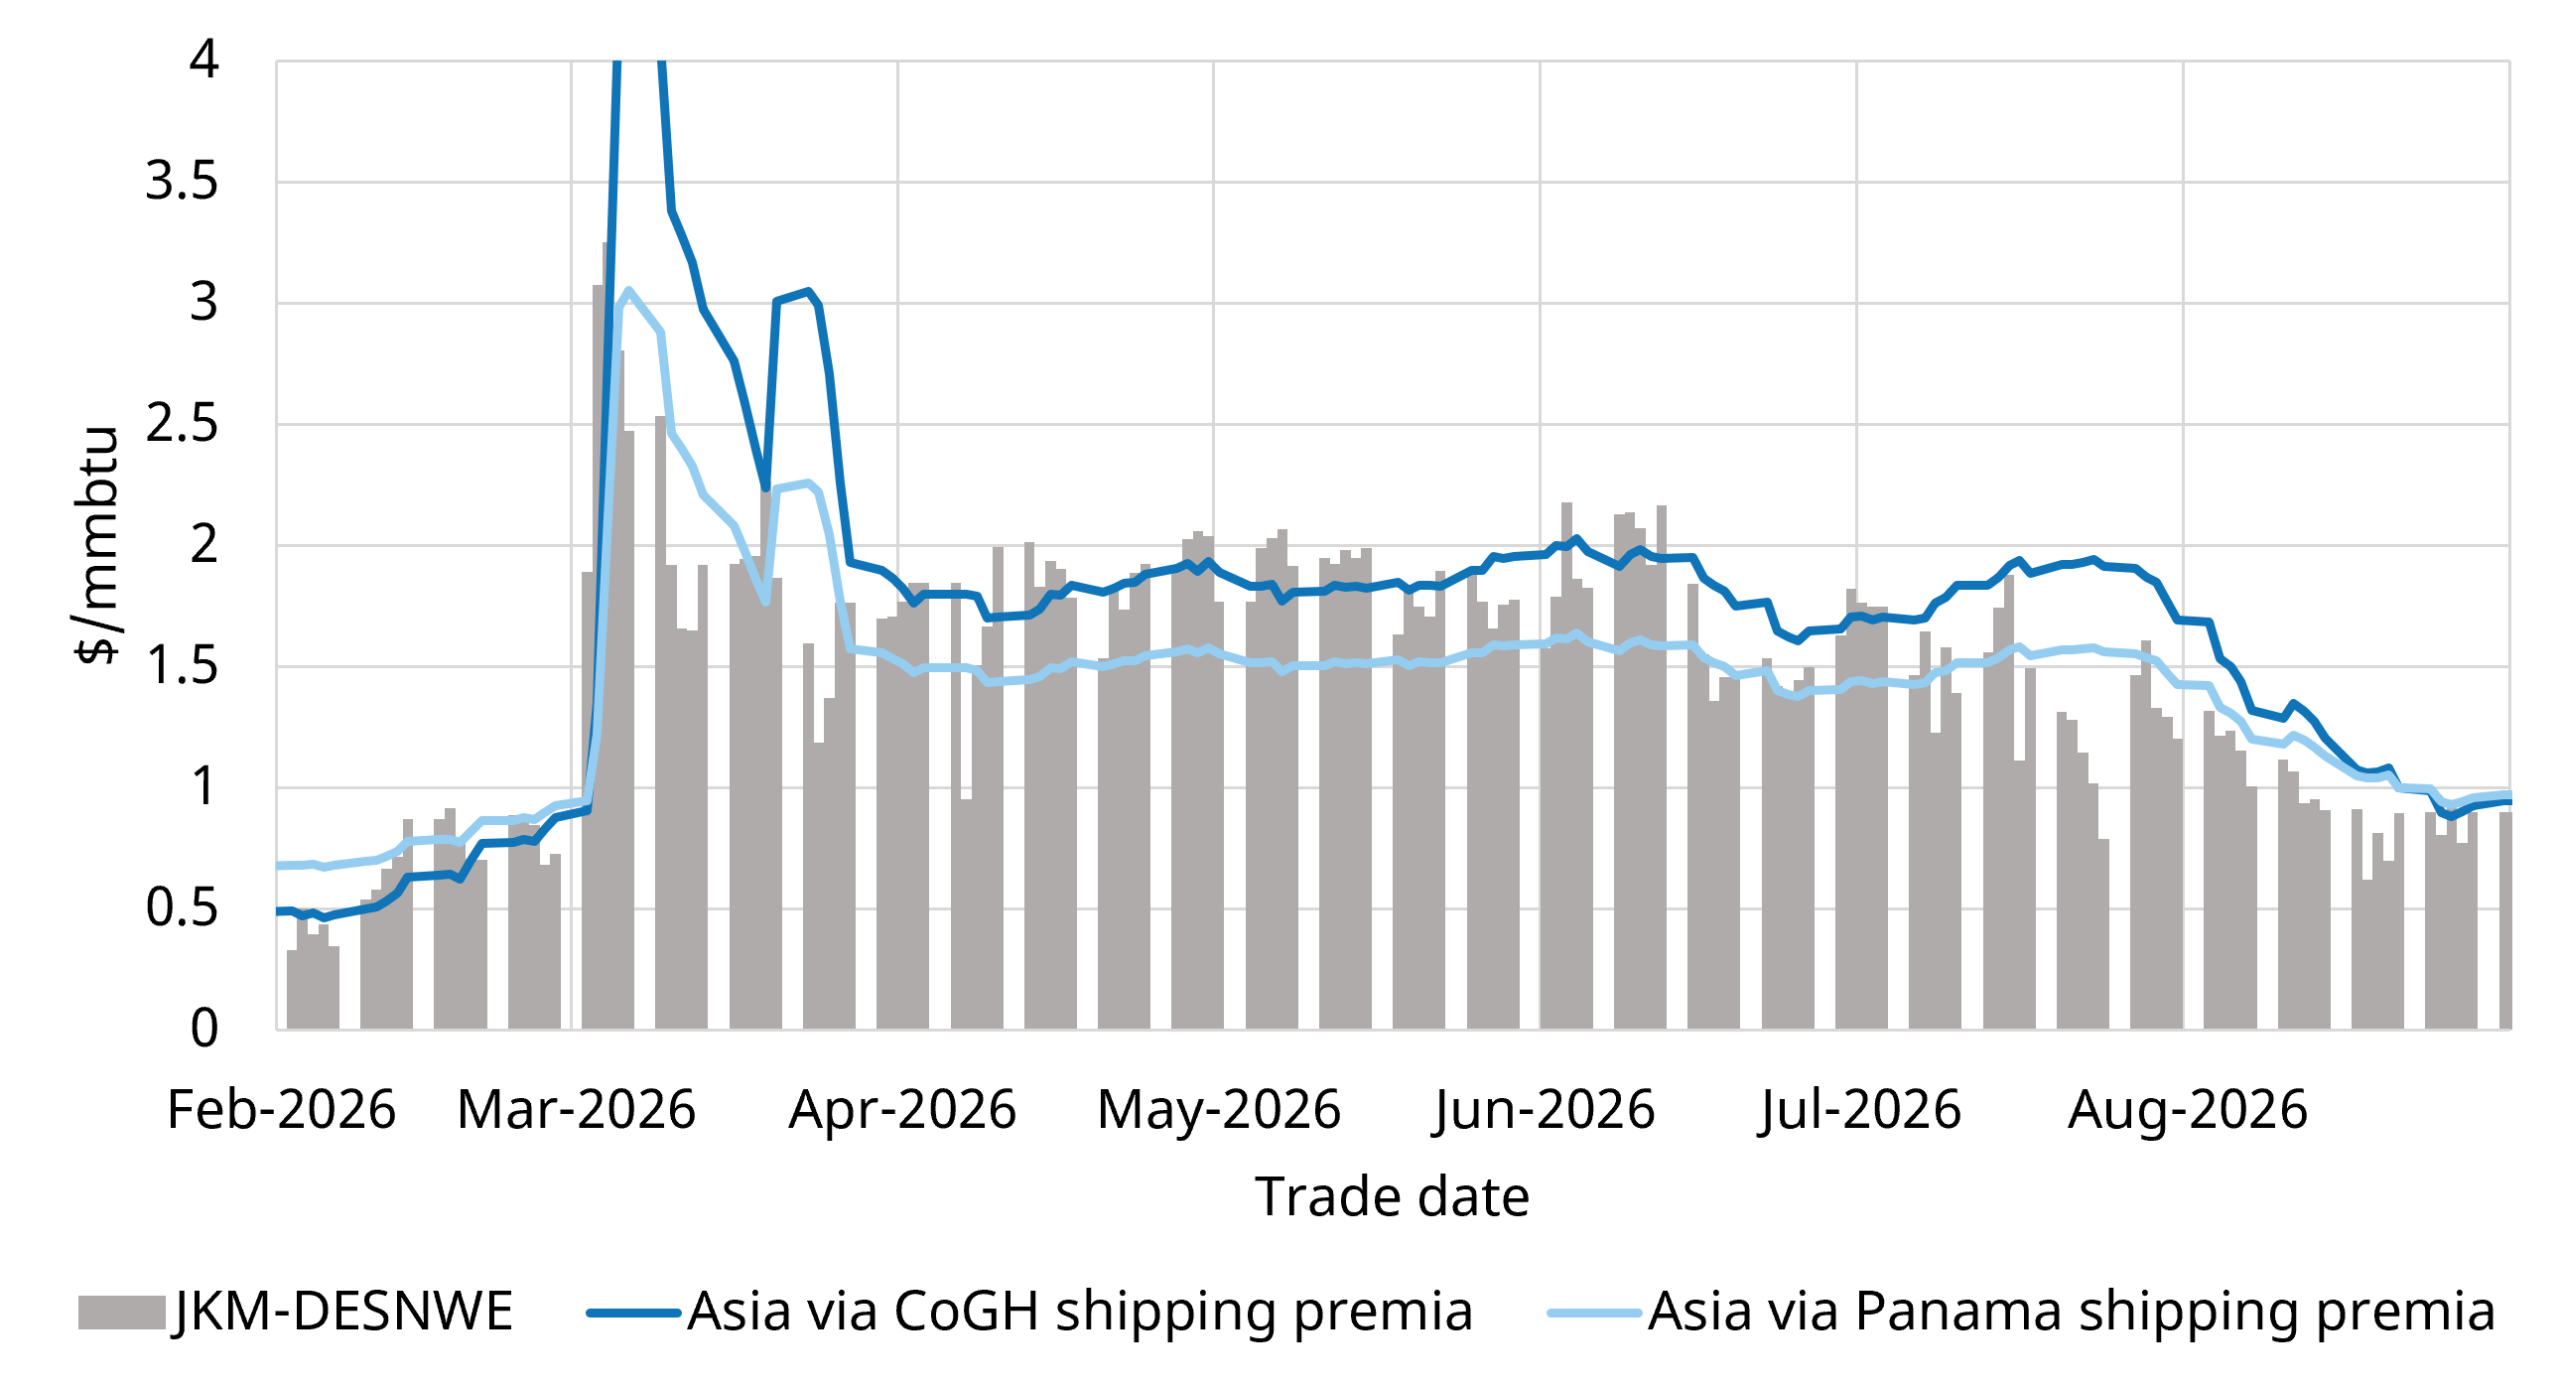
Source: Timera, Spark, ICE, CME Note, X-axis is trade date. Contracts used are HH MA, TTF MA, spot charters and JKM M+2/3.
The market is reflecting the fact that with the Strait remaining closed, it can no longer rely on Europe simply injecting less gas to absorb the Hormuz supply loss. Instead, prices need to rise far enough to pull more LNG into Europe while simultaneously encouraging demand reductions elsewhere.
These incremental LNG deliveries to Europe incentivised by rising prices over the past two months are beginning to show up – supporting injections as shown in chart 3 – and look set to continue over at least the next two months.
5. Gas prices are moving into demand-destruction territory
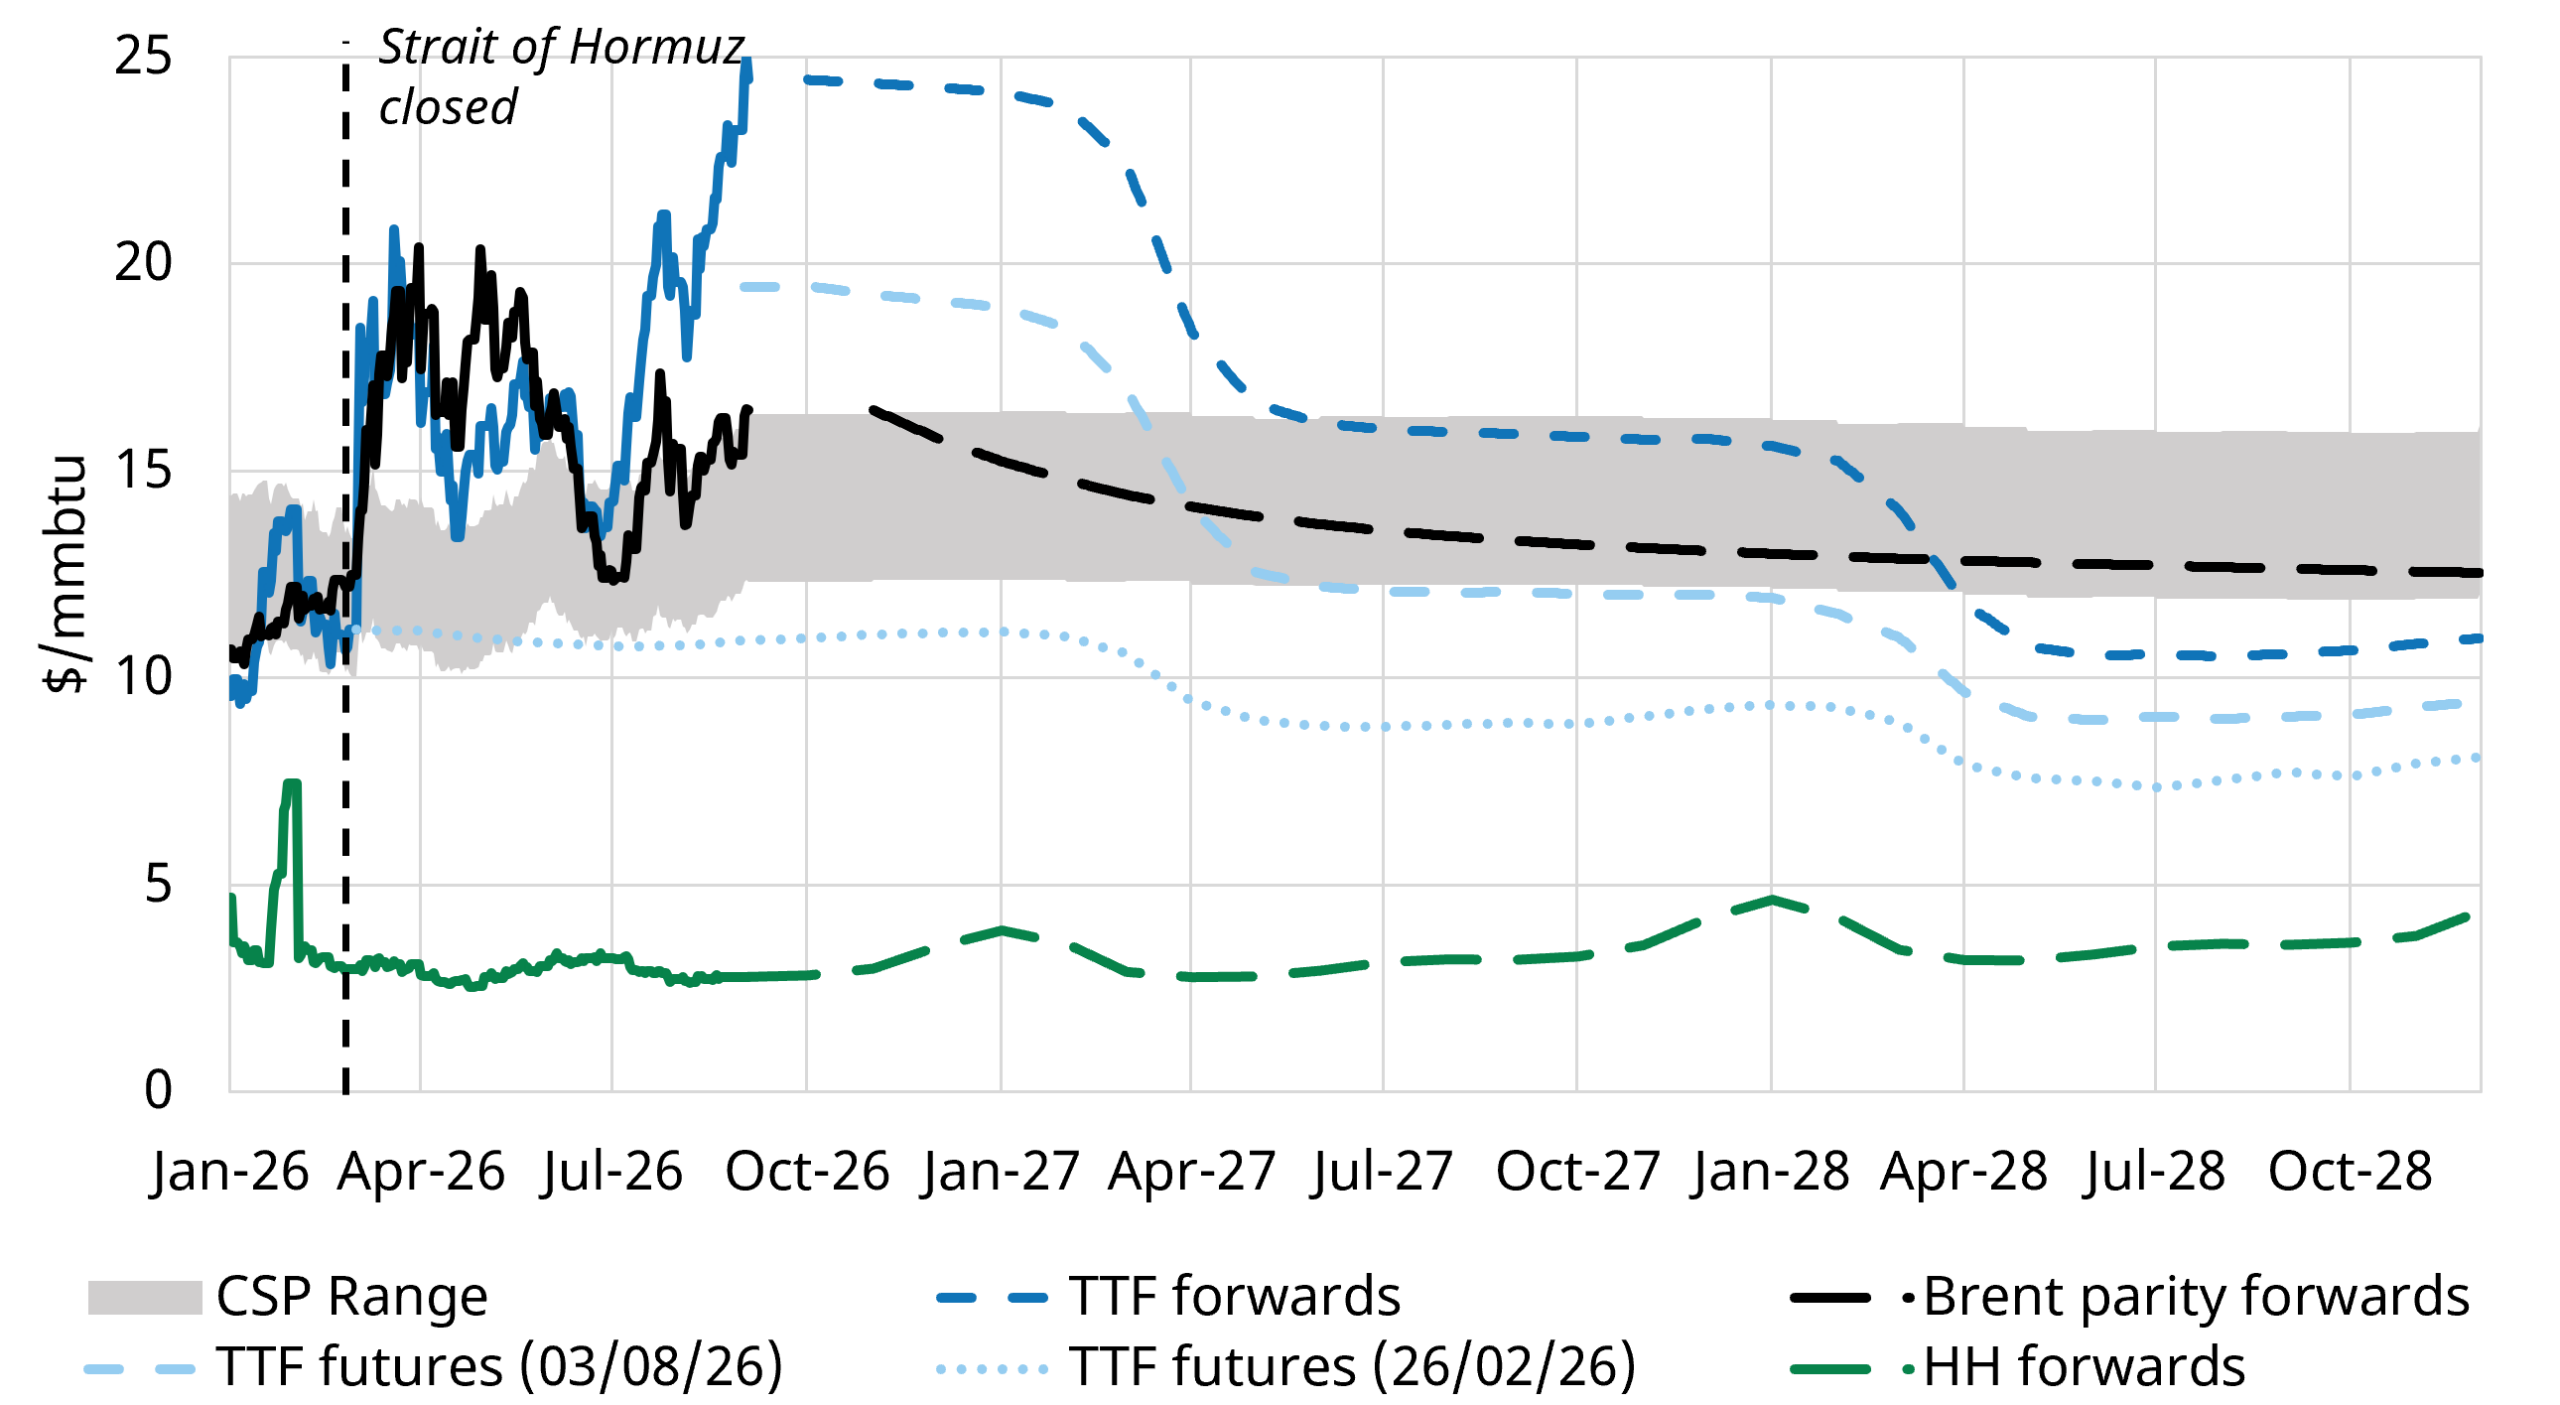
These tightening fundamentals are now feeding directly into price as shown in Chart 5. The move is most pronounced at the prompt, but the disruption is increasingly being priced further along the forward curve as the market assigns greater probability to a prolonged supply shock.
Chart 5: Global gas forward curves and fuel-switching parity thresholds
Source: ICE, CME, Timera
Prices through the end of winter have moved well beyond normal fuel-switching thresholds and into levels where more meaningful industrial and power-sector demand destruction becomes important.
The key risk is winter. With European storage already depleted, a prolonged Hormuz disruption would leave the market running rapidly up an increasingly inelastic demand curve. That creates a clear asymmetric upside risk to prices, alongside the potential for wider intra-European spreads where regional storage positions are particularly tight.
We will be back for with a full winter outlook in a few weeks. But in the meantime feel free to reach out to Luke Cottell (Associate Director) luke.cottell@timera-energy.com if you would like to discuss our fundamental LNG & gas market analysis further, either online or at Gastech.
Timera is hiring
We are growing our team and looking for experienced candidates with a passion for energy. Building on 15 years advising leading energy investors and companies, we are currently hiring for:
- Principal / Senior Analyst – Power
Interested in more details? Please contact us via recruitment@timera-energy.com.
Timera has established recruitment partners in place and kindly asks other agencies not to contact us.