“Flexible supply comes at a cost”
Europe’s gas system must bridge a huge seasonal gap. During the 2025-26 gas storage year, peak daily demand was around five times the lowest demand day in the Netherlands and almost seven times in GB. Both markets need flexible supply, but they access it in very different ways.
That difference matters for price. Dutch seasonal storage can absorb summer gas and release it through winter. GB has very little seasonal storage and relies much more heavily on LNG. As Europe approaches winter with unusually low inventories, the Dutch market may need to behave more like GB, increasing exposure to short-term price spikes.
Two markets and two balancing models
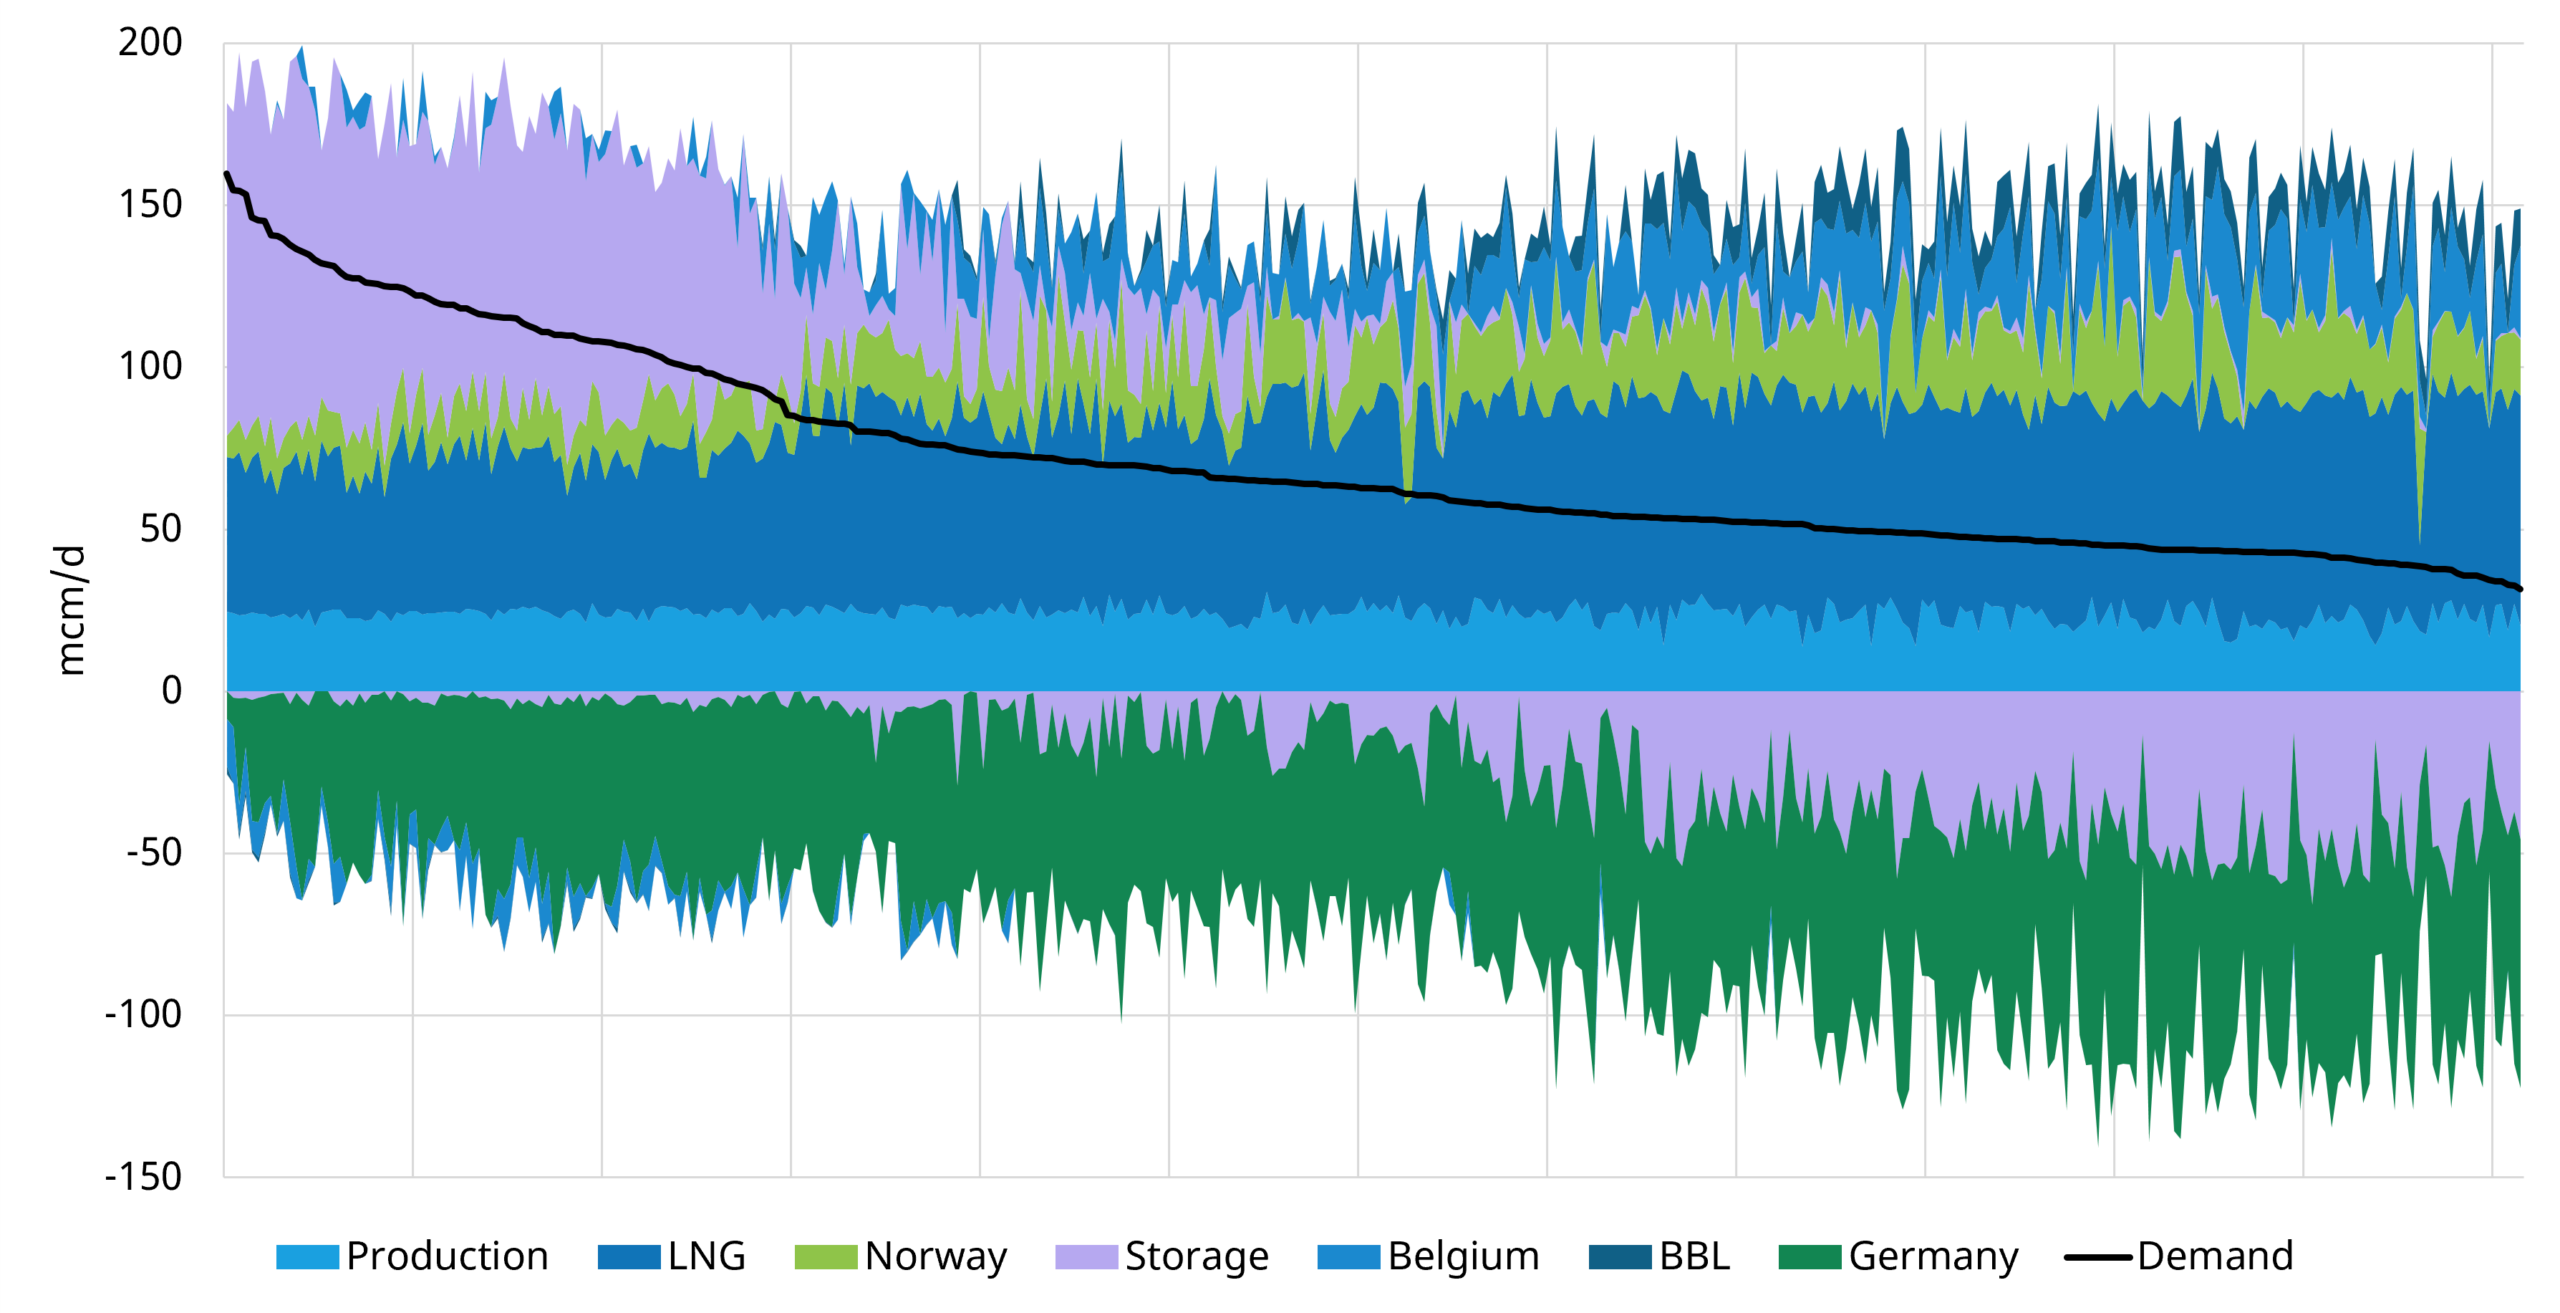
Load duration curves (LDCs) rank every day from highest to lowest demand and show how supply responds. They reveal which sources provide baseload volumes, which flex with demand and where surplus gas goes. Chart 1 shows the Netherlands LDC across the most recent gas year.
Chart 1: Netherlands gas market load duration curve (April 2025 - March 2026)
Source: Timera Energy, ENTSOG, GIE
The chart shows how the Netherlands combines relatively stable domestic production, LNG and Norwegian flows with a large seasonal storage position.
Withdrawals rise sharply on high-demand days, while injections absorb gas when demand is lower. The market also acts as a transit hub: exports to Germany are structural, Belgian flows provide additional swing and smaller BBL imports from GB appear during lower-demand periods.
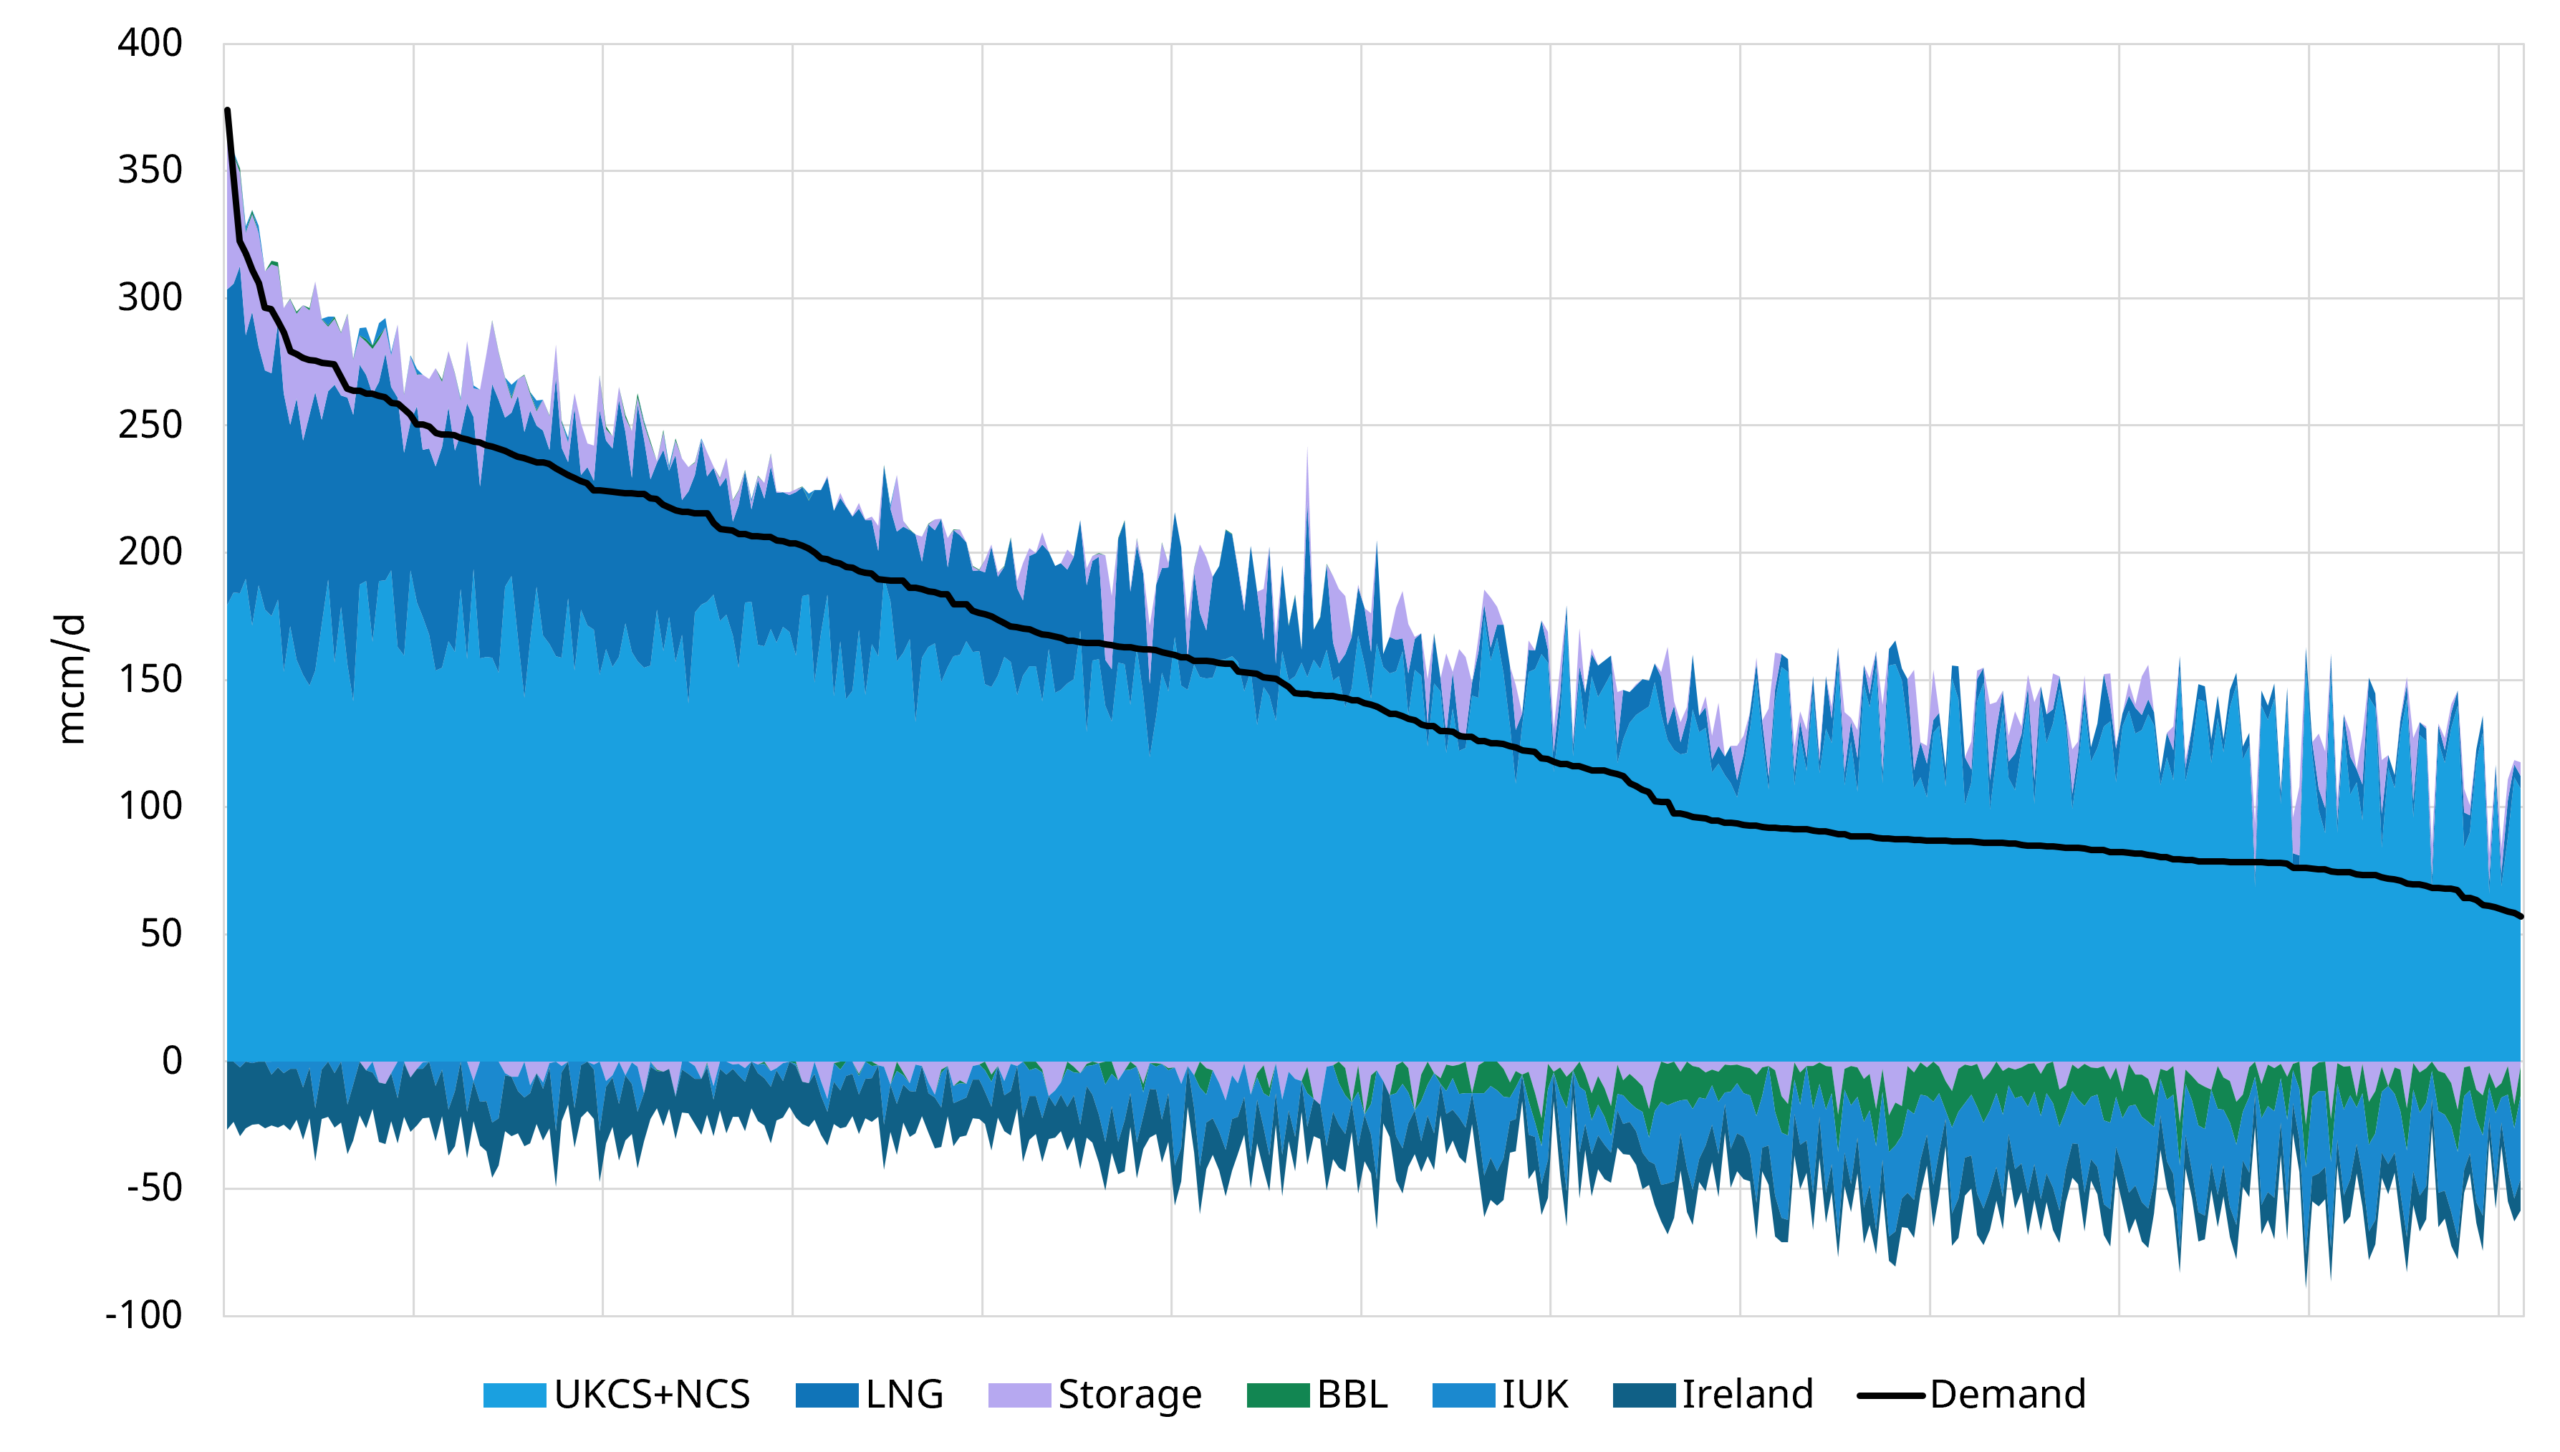
Chart 2 illustrates the structural differences in the GB market LDC.
Chart 2: GB gas market load duration curve (April 2025 - March 2026)
Source: Timera Energy, ENTSOG, GIE
The GB market has a different balancing model. GB has strong baseload supply from the UK and Norwegian continental shelves, but LNG is its main source of seasonal swing. Storage contributes on the tightest days, but its role is much smaller. In summer, GB cannot park much surplus gas in storage, so it exports length to the Netherlands and Belgium through BBL and IUK.
Storage changes how prices respond
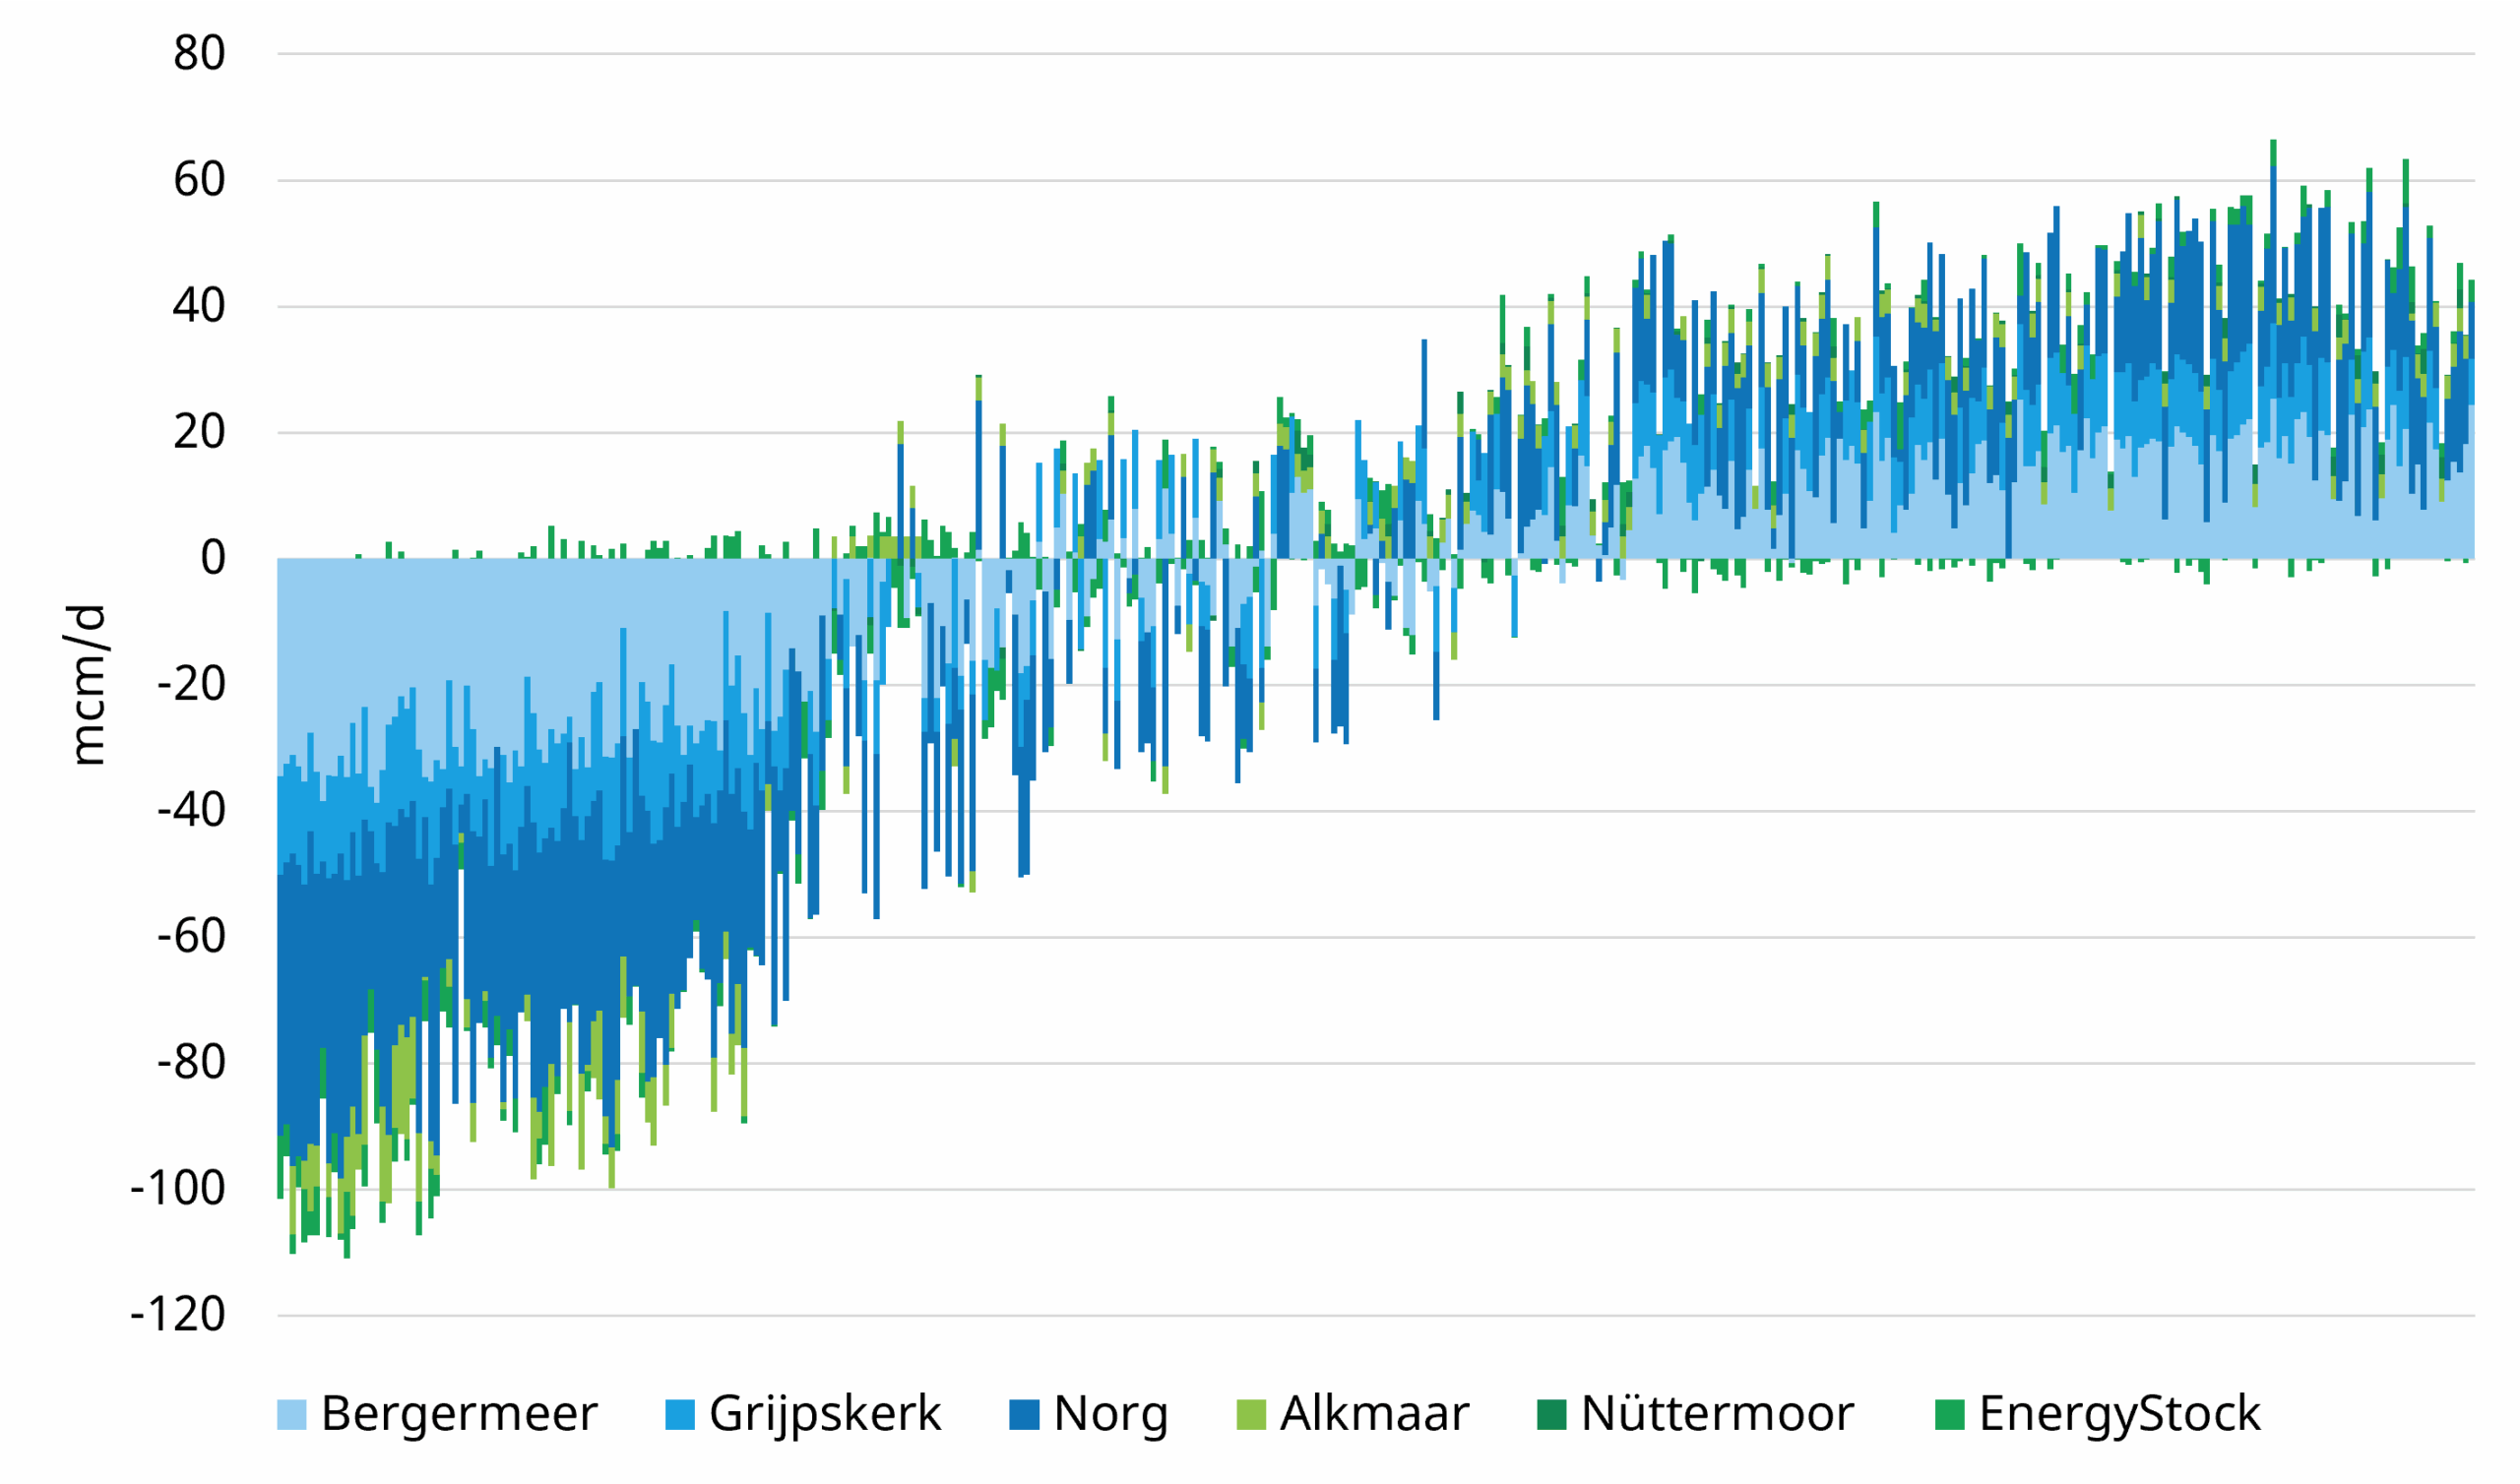
Chart 3 shows the scale and seasonal cycling of Dutch storage. Total capacity is around 13 bcm, compared with only around 0.5 bcm in GB. Large Dutch sites such as Bergermeer, Grijpskerk and Norg move substantial volumes from summer into winter.
Chart 3: Dutch storage utilisation ranked by market demand
Source: Timera Energy, GIE
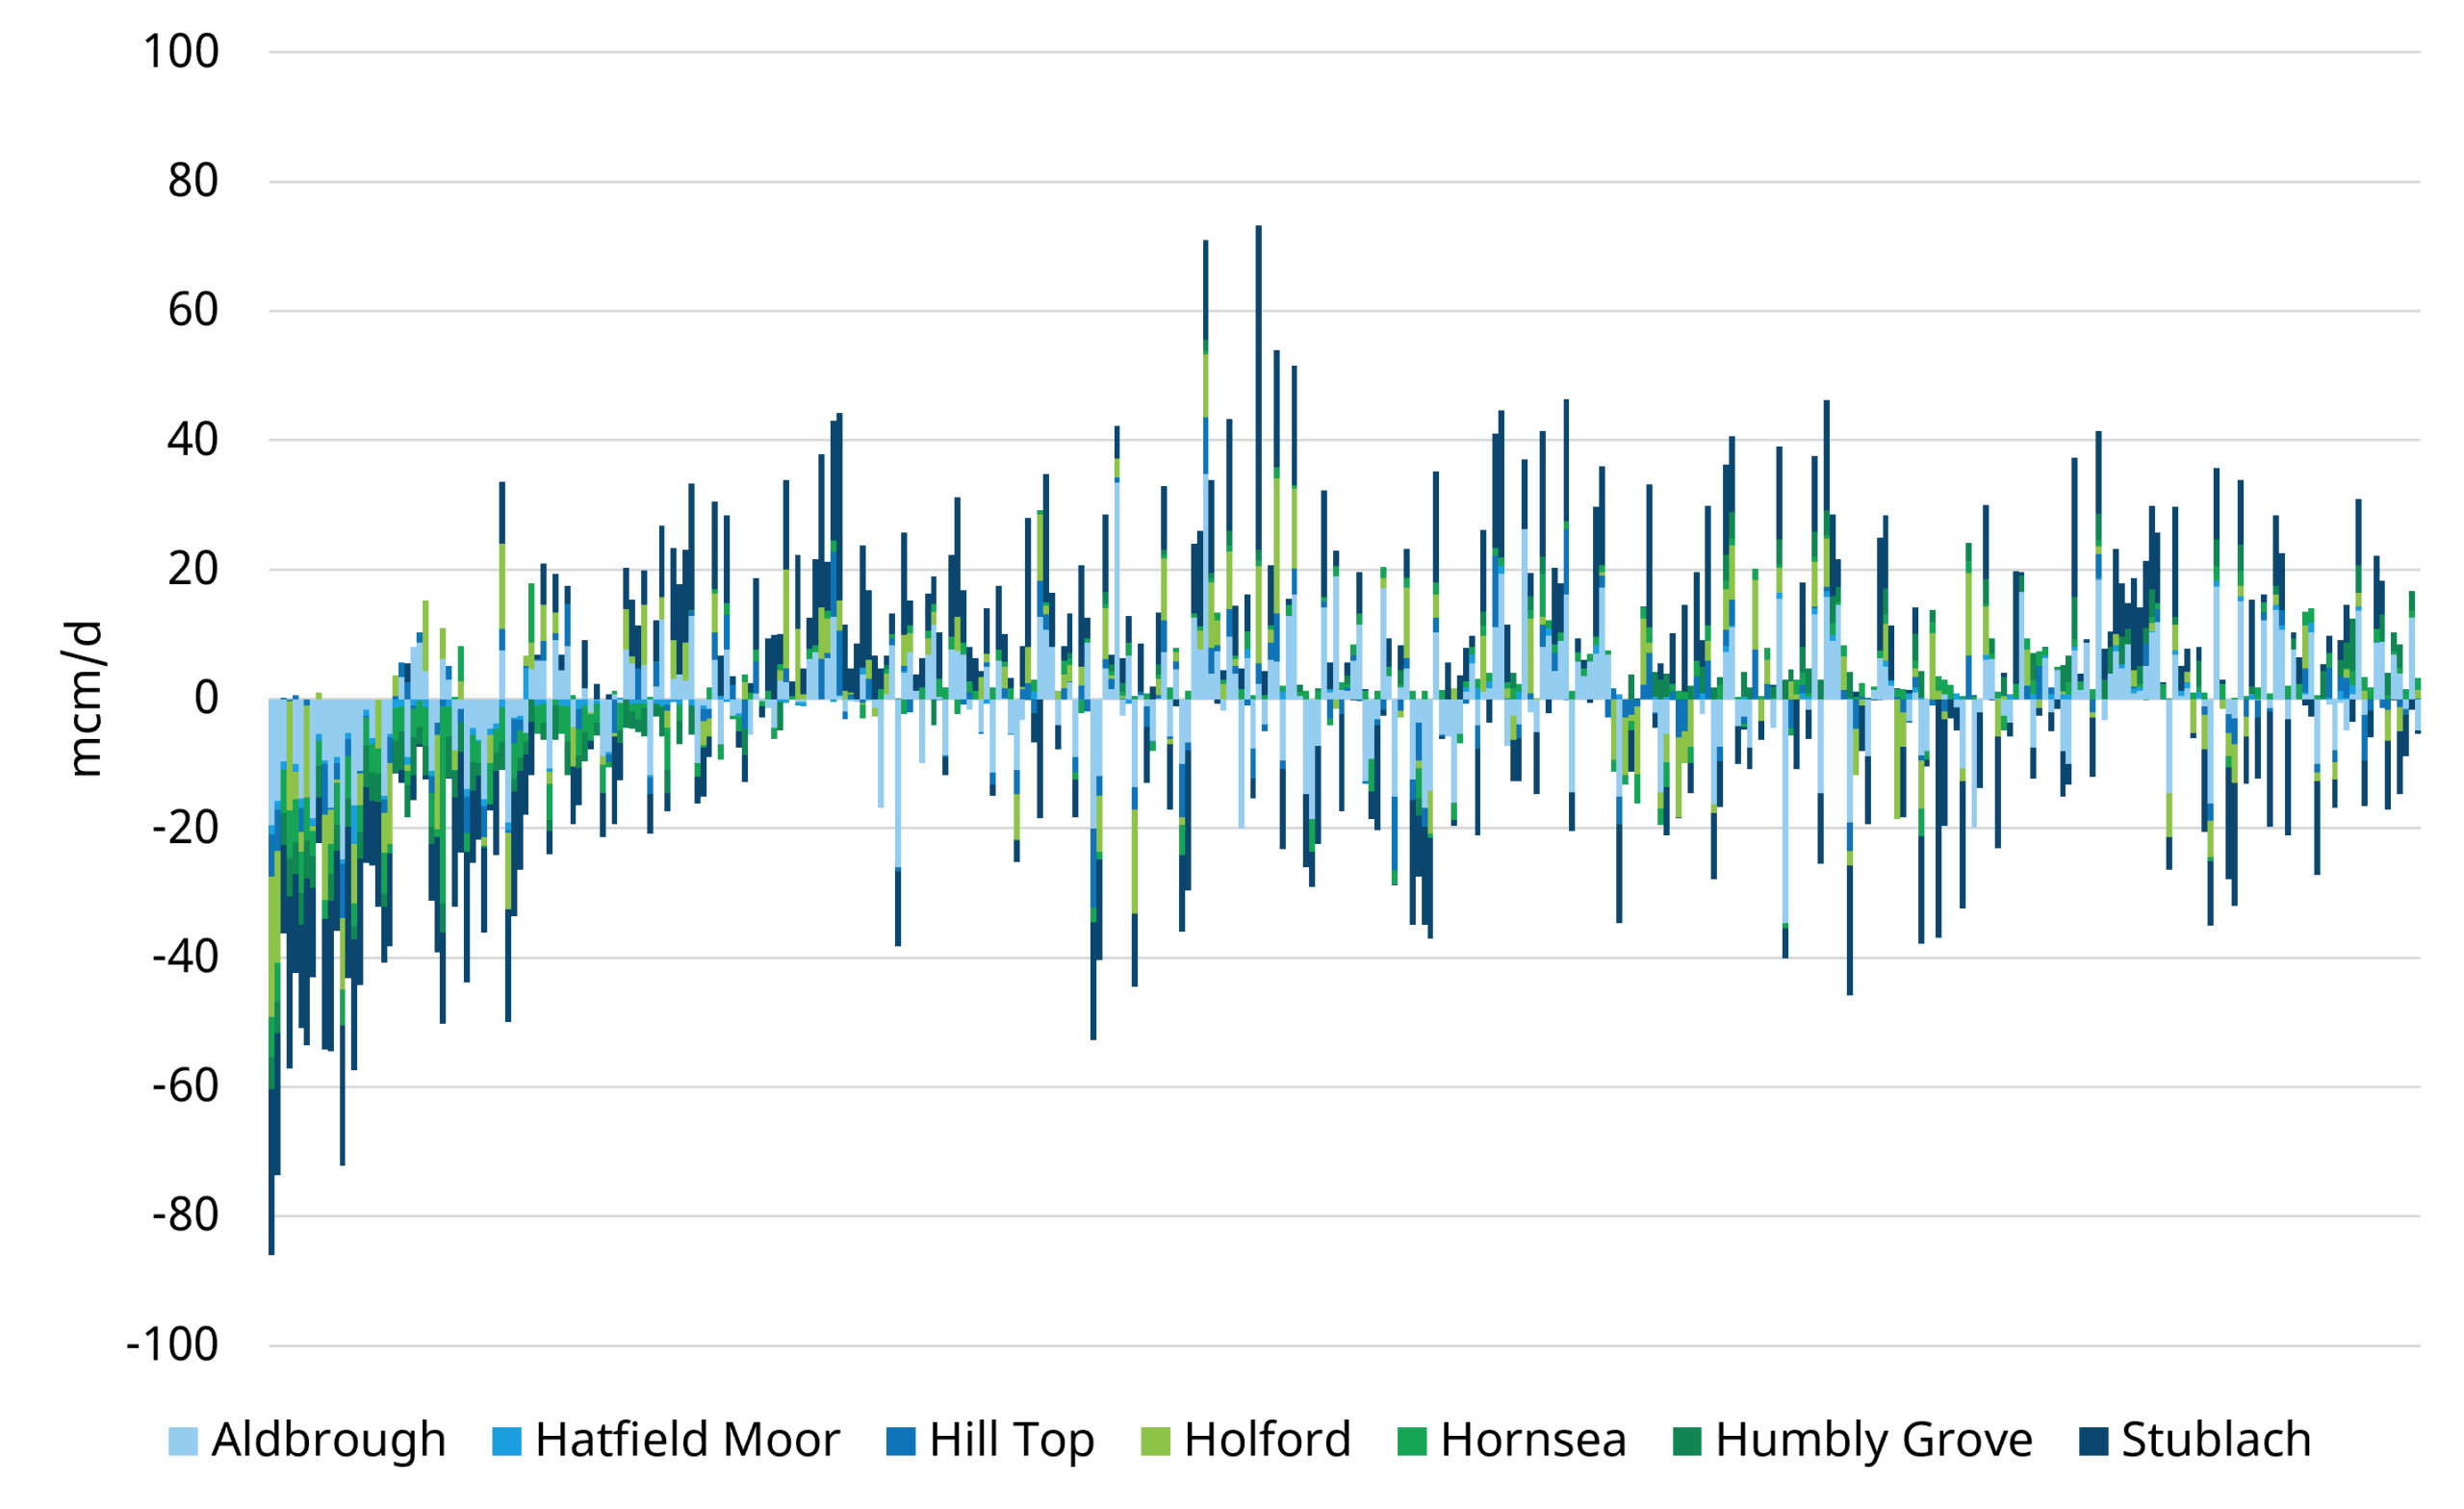
Chart 4 shows how GB storage operates differently. Faster-cycling sites respond to shorter-tenor signals, shifting gas within months and across weekends rather than carrying a large seasonal reserve. Their more erratic injection and withdrawal pattern remains visible even on lower-demand days.
Chart 4: GB storage utilisation ranked by market demand
Source: Timera Energy, National Gas Transmission
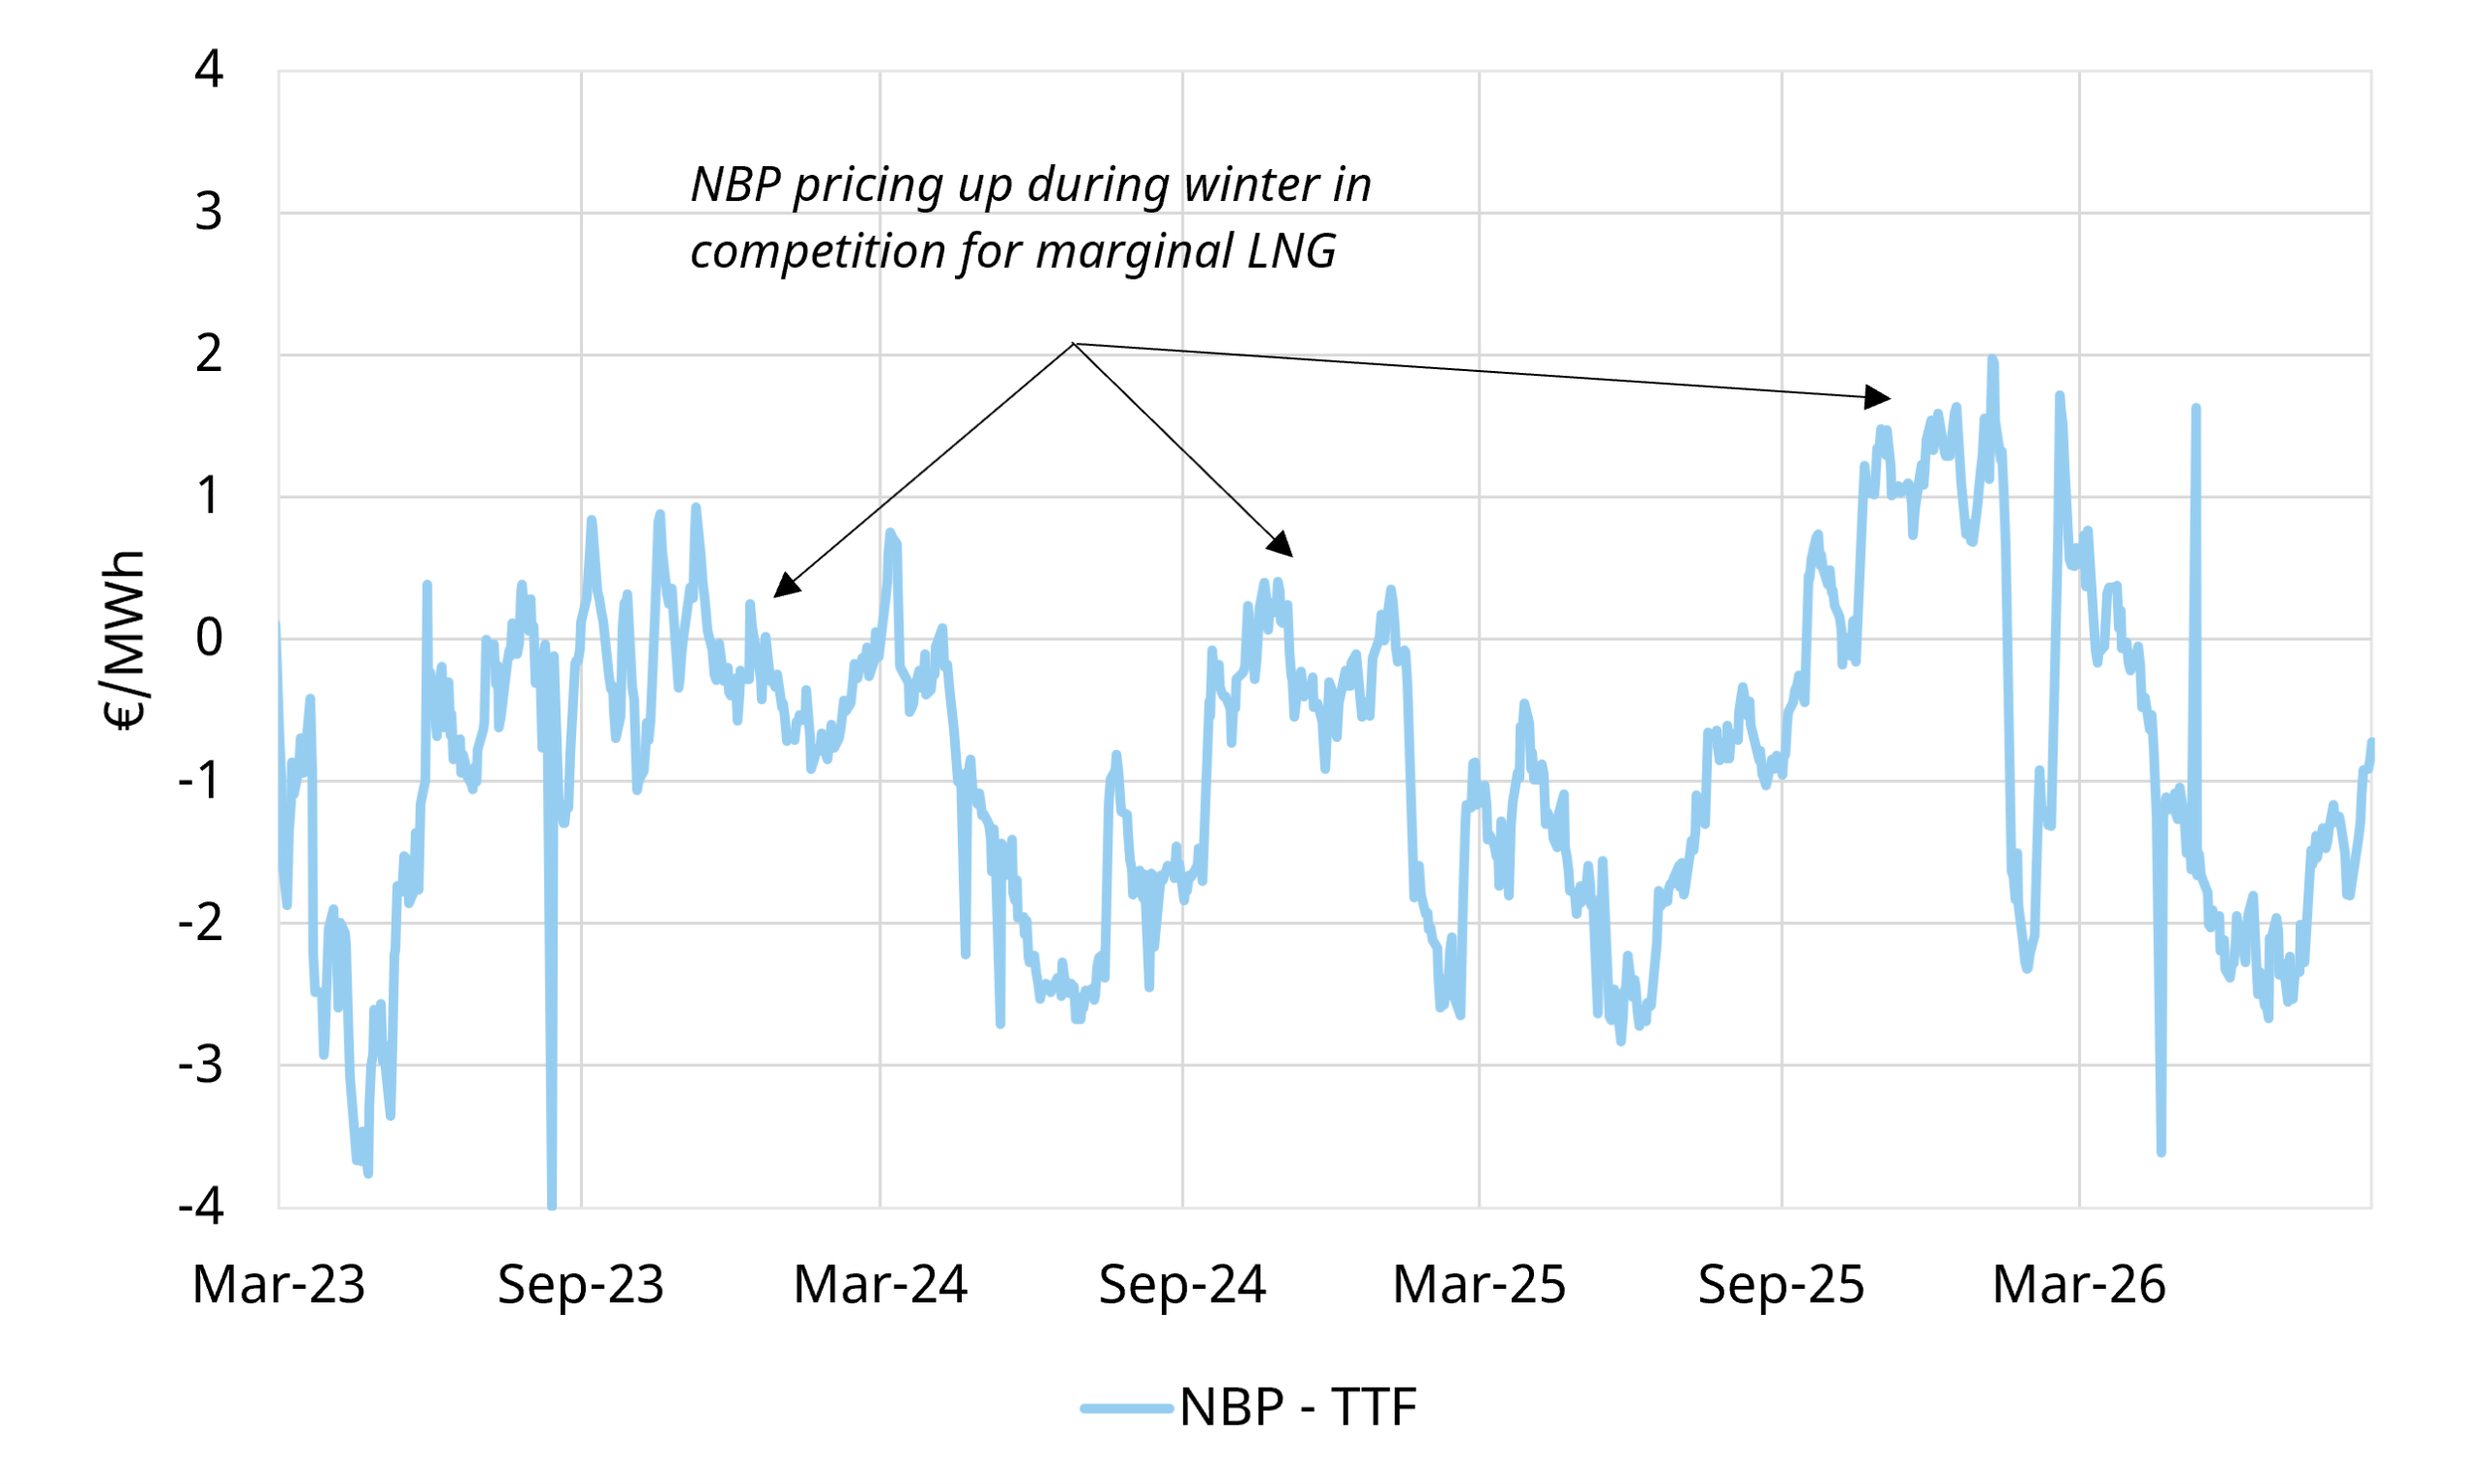
This leaves GB paying for flexibility through LNG. Cargoes can respond to sustained price signals, but shipping and diversion lags limit their ability to meet an abrupt cold-weather shock. NBP therefore tends to show stronger seasonality and greater short-term spike risk than TTF, where deep continental storage provides a larger buffer. Chart 5 illustrates how sharply the NBP premium to TTF can move.
Chart 5: NBP premium to TTF
Source: Timera Energy, ICE
A thinner Dutch buffer this winter
European storage is currently around 67% full, with Dutch inventories closer to 50%. Disruption to LNG supply through the Strait of Hormuz has pushed prices higher and slowed injections. The market has balanced partly through lower European storage demand and weaker Asian LNG demand.
The consequence is a more fragile winter balance. With less gas in store, the Netherlands has less seasonal flexibility and must rely more heavily on LNG and interconnected supply, closer to the GB model. That increases the potential for volatility if cold weather or another supply shock emerges faster than cargoes can respond. The risk is greatest late in winter, when remaining storage flexibility may be most constrained.
Storage levels alone do not determine winter prices. Weather, Asian LNG demand and supply availability will all matter. But lower inventories remove a key shock absorber, making the speed and cost of flexible supply central to this winter’s price distribution.
Timera’s winter outlook
We will shortly publish our global gas winter outlook, covering fundamentals, LNG flows, and probabilistic price distributions, within our Global Gas service, with key insights also shared on this blog.
For more information on our LNG & gas market analysis, contact Luke Cottell, Associate Director, Gas and LNG, at luke.cottell@timera-energy.com.