The European gas market has been shaped by LNG flows across the last 2 years. In Q2 2020, a huge surplus of cargos due to the Covid induced demand shock, drove a TTF price plunge below 2 €/MWh. Less than 9 months later in Jan 2021, an acute shortage of LNG in Asia saw all available cargoes diverted from Europe.
“Structural market tightening has been weighing on seasonal spread levels… but spot price volatility is rocketing higher”
There are two important mechanisms that are supporting the European gas market absorb ebbs & flows in LNG imports.
- Power sector switching which we covered in a recent article
- Gas storage flexibility which we look at today.
In this week’s article we review current year storage dynamics vs the last 5 years and look at the evolution of key price signals driving storage value.
Rapid withdrawal trajectory
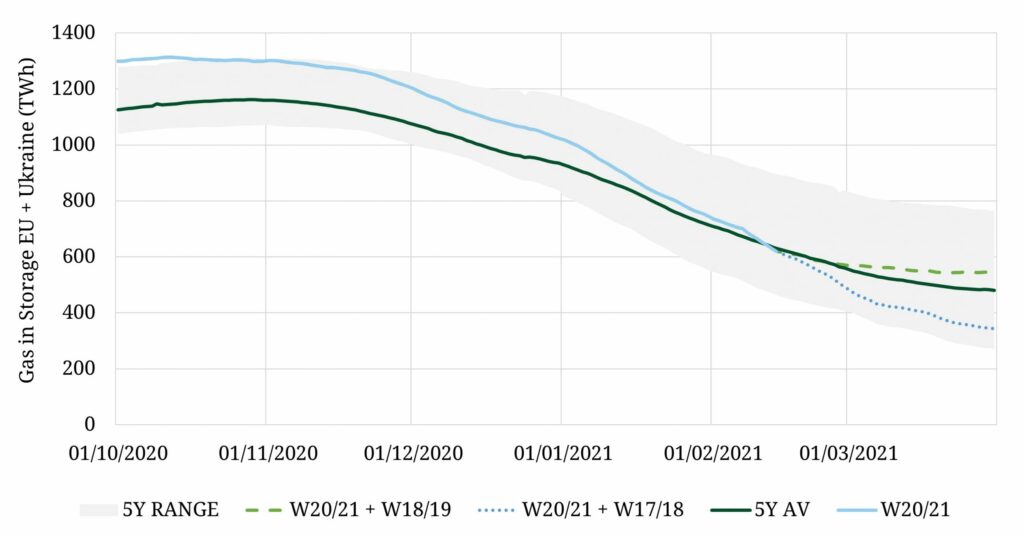
Europe entered Winter 2020-21 with inventories at 5 year highs as shown in Chart 1.
High stock levels were driven by the Covid demand shock dynamics of 2020. Inventories were seasonally high heading into last summer and rose rapidly as surplus volumes of LNG flowed to Europe and very low priced gas was injected into storage. Summer 2020 also saw a substantially increased role for Ukranian storage, acting as a ‘sink’ for surplus gas in order to allow the market to clear (along with US cargo cancellations).
The 2020 flood of LNG into Europe swung to drought in Q1 2021, as soaring Asian LNG demand and spot price levels saw cargos diverted away from Europe. The resulting gap in European LNG imports has been plugged by faster than normal storage withdrawals.
The largest drawdowns have been in Germany, as Gazprom pulls on equity storage to support strong sales volumes in January, despite a drop in transit import volumes from Russia.
Chart 1 shows storage stocks for this winter (blue line) now below their 5 year seasonal average trajectory (black line). The green dashed line and blue dotted line illustrate potential trajectories across the remainder of the winter based on the maximum (Winter 18-19) and minimum (Winter 17-18) withdrawal paths across the last 5 years.
A tale of two price signals
The value of gas storage capacity is driven by two key market price signals:
- Seasonal price spreads drive the value of seasonal flexibility
- Spot price volatility drives the value of deliverability (i.e. flexibility response near to delivery).
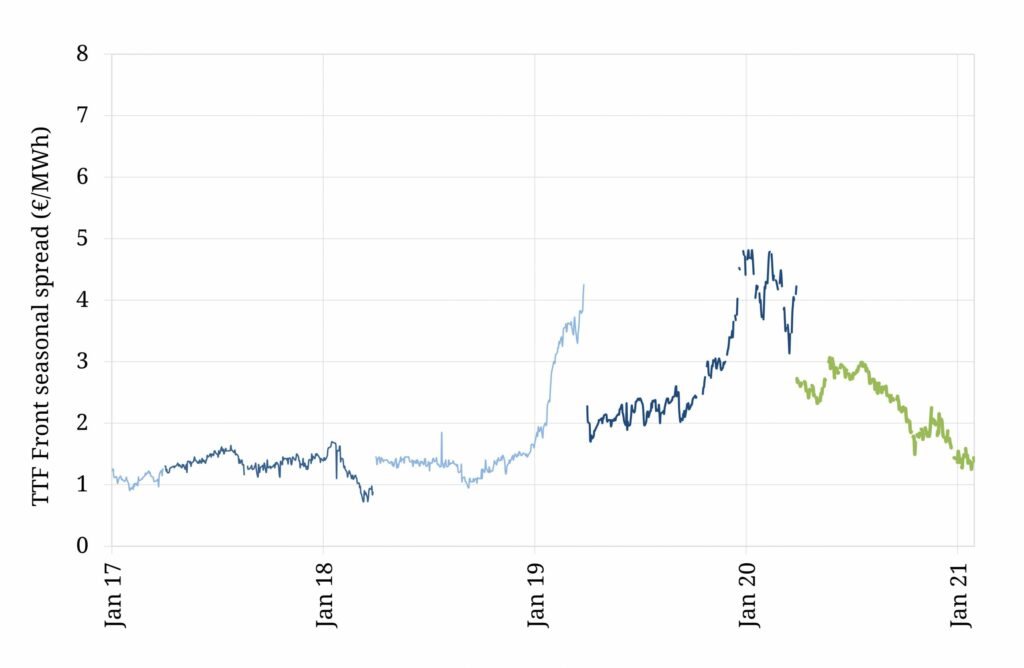
Chart 2 shows the recent evolution of seasonal price spreads at TTF.
Across 2017 – 18, seasonal price spreads remained at relatively depressed levels, anchored by the variable cost of cycling seasonal storage assets (between 1.00 – 1.50 €/MWh).
Seasonal spreads then rose substantially in 2019 – 20. The primary driver of this increase was declining summer prices in an oversupplied gas market and robust volumes of surplus LNG flowing into European hubs. In other words the TTF curve was in contango (upward sloping) with the front summer contract pushed below the subsequent winter.
Both the European gas market and global LNG market reached a major inflection point in Q2 2020. Since then, a structural market tightening has seen a closing of the price gap between seasons, as the summer price has recovered relative to winter. The TTF forward curve is now in backwardation which is putting pressure on seasonal spread levels.
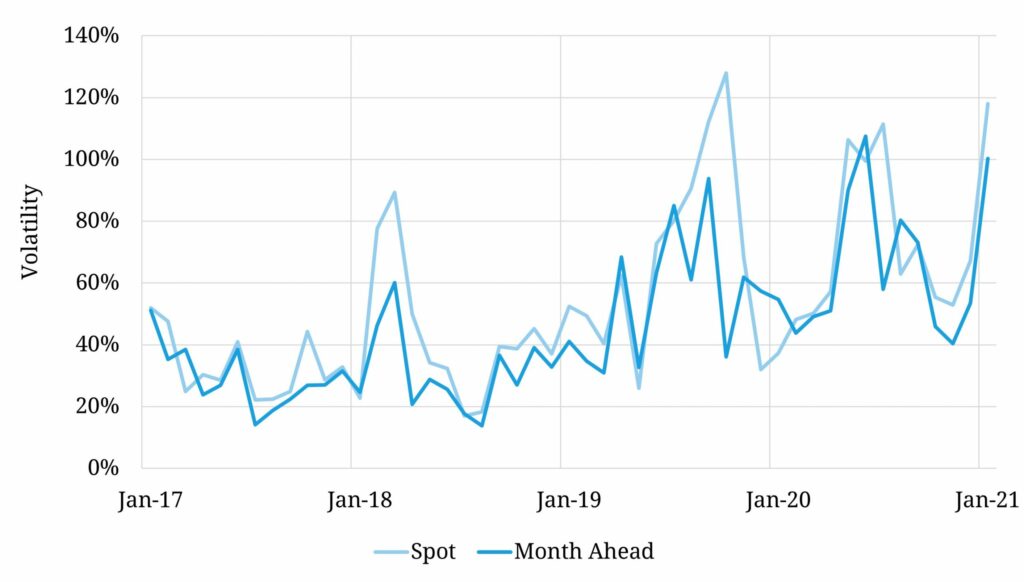
Market tightening has had a much more constructive impact on spot price volatility as shown in Chart 3.
Volatility has rocketed to its highest level in more than 10 years across the last 12 months. This has been supported in Jan 2021 by the impact of surging spot LNG prices.
Rising price volatility is good news for the value of gas storage capacity, particularly fast cycle storage. This is consistent with an article we published in Sep 2020 showing a recovery in fast cycle storage margins over the past few years against a backdrop of declining European gas supply flexibility.
The requirement for short term deliverability is set to continue to rise, as the closure of coal & nuclear plants leads to an increased flexibility requirement from gas fired plants to smooth out renewable output.